SolarWinds THWACK
THWACK
  • Sign In
  • Search
  • Product Forums
    • Observability
      • SolarWinds Observability
      • Hybrid Cloud Observability
      • DevOps
    • The Orion Platform
      • Forum
      • Scalability Engines (HA, APE, AWS)
      • Enterprise Operations Console (EOC)
      • Orion SDK
      • Alert Lab
      • Report Lab
    • Network Management
      • Network Performance Monitor (NPM)
      • NetFlow Traffic Analyzer (NTA)
      • Network Configuration Manager (NCM)
      • IP Address Manager (IPAM)
      • User Device Tracker (UDT)
      • VoIP & Network Quality Manager (VNQM)
      • Log Analyzer
      • Engineer’s Toolset
      • Network Topology Mapper (NTM)
      • Kiwi CatTools
      • Kiwi Syslog Server
      • ipMonitor
    • Systems Management
      • Server & Application Monitor (SAM)
      • Virtualization Manager (VMAN)
      • Storage Resource Monitor (SRM)
      • Server Configuration Monitor (SCM)
      • SolarWinds Backup
      • Web Performance Monitor (WPM)
    • Database Management
      • Database Performance Analyzer (DPA)
      • SQL Sentry
      • Database Performance Monitor (DPM)
      • Database Mapper
      • Task Factory
    • Application Management
      • AppOptics
      • Loggly
      • Papertrail
      • Pingdom
      • DevOps
    • IT Security
      • Access Rights Manager (ARM)
      • Identity Monitor
      • Security Event Manager (SEM)
      • Patch Manager
      • Serv-U FTP & MFT
    • IT Service Management
      • SolarWinds Service Desk (SWSD)
      • Web Help Desk (WHD)
      • DameWare Remote Support (DRS)
      • DameWare Remote Everywhere (DRE)
      • DameWare Mini Remote Control (MRC)
  • Resources
    • THWACK Command Center
    • DevOps
    • What We're Working On
    • Blogs
      • Community Announcements
      • Product Blog
      • Monitoring Central
      • Geek Speak
      • The DevOps Blog
    • THWACK Tech Tips
    • Movies and Mainframes
    • Support
      • Success Center
      • Documentation
      • Submit a Support Ticket
      • Customer Portal
      • Renew Maintenance
    • Community Groups
      • New To THWACK
      • Federal & Government
      • User Experience
      • EMEA Group
      • Japan Group
  • Events, Missions, & Musings
    • Events
      • THWACK Livecast
      • THWACK Livecast Archive
      • SolarWinds Lab
      • SolarWinds Lab Archive
      • THWACKcamp 2022 On Demand
      • SolarWinds User Groups
      • SolarWinds Events Calendar
    • Missions & Contests
      • Monthly Mini-Mission: Running the IT Pro Gauntlet
      • THWACK 101
    • Musings
      • Water Cooler
      • Geek Tank
      • IT Tech Jobs/Careers
      • Monitoring for Managers
    •  
      •  
  • Content Exchange
    • The Orion Platform
      • Alerts
      • Custom HTML
      • Custom Queries
      • Modern Dashboards
      • Reports
      • Scripts
    • Network Performance Monitor
      • Device Pollers
      • Universal Device Pollers (UnDP)
    • Network Configuration Manager
      • Config Change Scripts
      • Device Templates
      • Firmware Upgrade Templates
      • Policy Documents
    • Server & Application Monitor
      • API Pollers
      • Application Monitor Templates
    • Server Configuration Monitor
      • Policies
      • Profiles
    • Database Performance Analyzer
      • Custom Alerts
      • Custom Metrics
      • Custom Queries
    • Web Help Desk
      • Style Sheets
  • Academy
    • Newsroom
    • Forums
      • Classroom Discussions
      • SolarWinds Certified Professional (SCP)
    • Training & Certification
  • Free Tools & Trials
  • Store
The Orion Platform
  • Content Exchange
  • More
The Orion Platform
Modern Dashboards Networks Summary - Alert Status
  • Tags
  • More
  • Cancel
Options
  • View all
  • Previous
  • Next
  • View slideshow
  • More
  • Cancel
fileName

Networks Summary - Alert Status

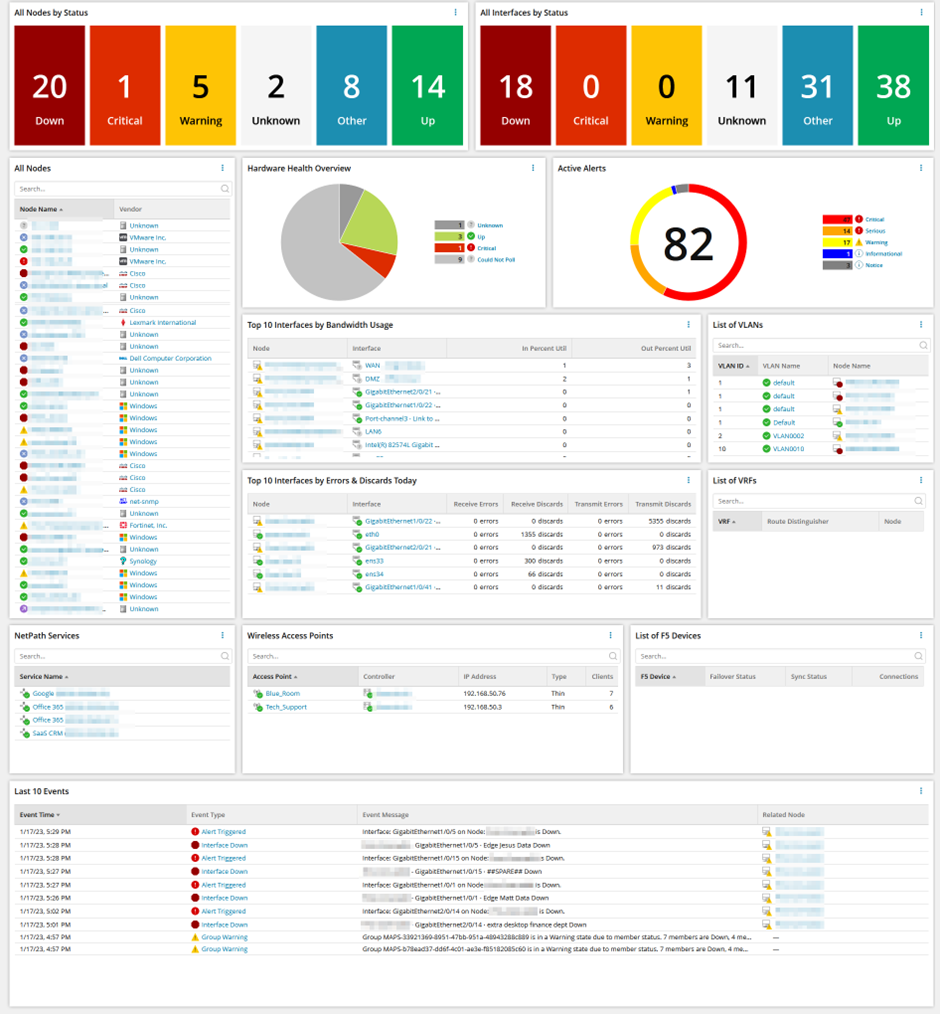
I love working with Modern Dashboards and took it upon myself as a personal challenge to re-create the most important information from the Network/Systems Summary classic dashboards. To do this, I looked at the classic widgets, reviewed the data they presented, and looked at the target of any clicks. With this information at hand, I built this set of dashboards.

To get the full experience, you'll need to download and import the complete set of Modern Dashboards for Network or Systems.

Bundle of Modern Dashboards for Networks

  • Networks Summary
  • Networks Summary - Alert Status [This post]
  • Networks Summary - Hardware Status
  • Networks Summary - Interface Status
  • Networks Summary - Node Status

Reference the Importing/Exporting Modern Dashboards for how to use PowerShell and the SolarWinds Information Service Module to bulk import Modern Dashboards.

Discussed in detail on All in on Modern Dashboards.

  • summary
  • network
  • Networks Summary Bundle
  • Hybrid Cloud Observability
  • Platform 2022.3.0
  • Network Performance Monitor (NPM)
ecmel
ecmel
  • 16 Mar 2023
  • 130 Downloads
  • Share
  • More
  • Cancel
Anonymous

SolarWinds solutions are rooted in our deep connection to our user base in the THWACK® online community. More than 190,000 members are here to solve problems, share technology and best practices, and directly contribute to our product development process.

SolarWinds Customer Success Center Certification SolarWinds Lab Link Accounts
About THWACK Blogs Federal & Government Edit Settings Free Tools & Trials
Legal Documents Terms of Use Privacy California Privacy Rights Security Information
©2021 SolarWinds Worldwide, LLC. All Rights Reserved.