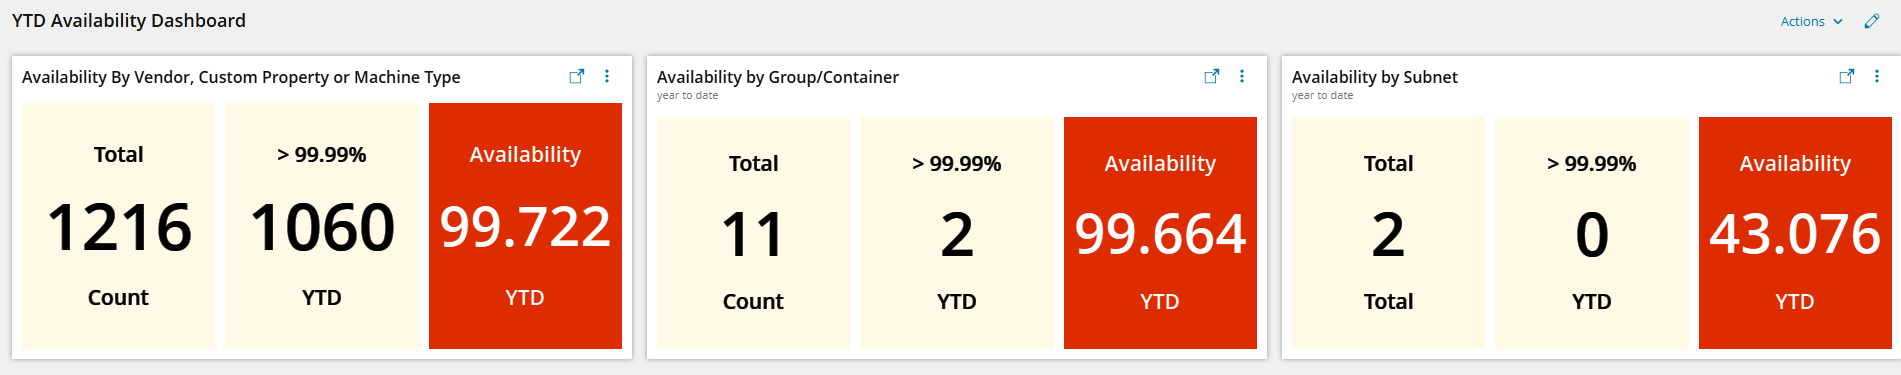
Our CTO wanted a YTD Availability dashboard of the various technologies and teams that we have in SolarWinds. I'm still working on application based YTD availability views, but this along made him a happy person.
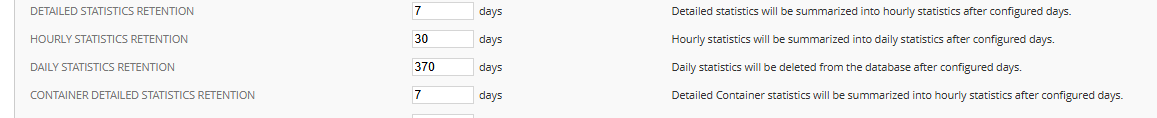
In order to correctly pull this off, the way he wanted it I had to increase the daily statistics retention to 370 days. Before you download this, please take this into account. I'm sure the report will work without upping the daily statistics. Adjust according to your environment.
Below is a screenshot of what the dashboard looks like. Provided are 3 different ways of doing the same availability. I set a threshold value of < 99.99 for the Availability YTD. The background will be green if the Availability YTD value is > 99.99.
To operate in full transparency, I added hyperlinks to a detailed report. The report clearly shows all nodes in the YTD calculation and their true availability in SolarWinds. The Report Manager queries should match the modern dashboard query, Below is for the Cisco Node YTD Availability report.
SELECT
round (AVG(n.ResponseTimeHistory.Availability),5) AS [True Availability]
,n.Caption
,n.DetailsUrl

FROM Orion.Nodes AS n

WHERE (1=1
and (n.MachineType like 'Cisco%'
and (n.status <> '9')
and (n.ResponseTimeHistory.DateTime >= TOLOCAL(CONCAT(YEAR(GETDATE()), '-01-01'))))

GROUP BY n.Caption, n.DetailsUrl
ORDER by 'True Availability' asc
with nolock
On more nugget that I do, is we have a limited view read-only guest account that's open to any employee who wants to login. The guest account has it's own modern dashboard and there's a tab that has all of my YTD availability reports. So at a quick glance a use can get an overview of how the networking team is doing, but if they go into the networking dashboard they'll see detailed availability by vendor, location, machine type, disposition and/or function.