Community
Command Central
MVP Program
Monthly Mission
Blogs
Groups
Events
Media Vault
Products
Observability
Network Management
Application Management
IT Security
IT Service Management
System Management
Database Management
Content Exchange
SolarWinds Platform
Server & Application Monitor
Database Performance Analyzer
Server Configuration Monitor
Network Performance Monitor
Network Configuration Manager
SQL Sentry
Web Help Desk
Free Tools & Trials
Store
The SolarWinds Platform
'Node Rebooted' NPM Events History - Last 3 Months
01_C2_OS - Cisco IOS Devices
30/60/90 Days Node Availability
Access Layer VLANs (with good/bad VLAN defined)
Acknowledge Solarwinds alert by email with oAuth and Azure AD
Alert HTML Content
Node Details widget to track start - end times for muted/unmanaged node
Slow Login (Domain Accounts Using Security Groups)
SolarWinds Platform
The SolarWinds Platform
01_C2_OS - Cisco IOS XE Devices
90/95/99th Percentile Traffic Rate - Last 30 Days
ARP Table Widget to replace previous legacy report
Active Alerts with Severity
Add missing ICMP/CPU/Memory pollers for Windows Server (PowerShell)
Alerts
Application Dashboard based on servers, Web URL's and Alert in SNOW and its incident numbers
Custom HTML Email Template for Device/Interface Up/Down Status (Problem/Clear/Reset Conditions)
Migration from Heroku AppOptics and Librato Add-ons to Papertrail Add-on
90/95/99th Percentile Traffic Rate - Last 7 Days
Active alerts with acknowledge notes
Add multiple DHCP servers to SolarWinds using SolarWinds SDK and PowerShell
Alert if the Polling Engine is not updating new data
Backup Dashboard
Custom HTML
Custom HTML Email Template for Device/Interface Up/Down Status (Problem/Issue Conditions)
Node Status Summary Widget
Test subjectt jpg
90/95/99th Percentile Traffic Rate - Last Month
Actual % Usage for IPAM IPv4 Supernets (Custom Table SQL)
Alert Action: HA Failover using PowerShell
Alert on Muted Node for more than 3 days
Basic Network Dashboard Starting Point
Custom Queries
Display Unique Google Map Per Group
Test subject png
90/95/99th Percentile Traffic Rate - Last Month [updated] for Percentile SQL Datasource
Actual % Usage for IPAM IPv6 Supernets (Custom Table SQL)
Alert on Unmanaged Node for more than 30 days
Automating Basic Kiwi Maintenance; Syncing StaticHosts File
Config Summary [System Dashboard]
Display Unique Map per Group
Modern Dashboards
90/95/99th Percentile Traffic Rate - This Month
Agent Status Summary (With Hover-over ability)
Alert when SWOSH is critical
Automation script to restart service when any service is down via external program trigger action
Custom Alert with Acknowledgment and Note Capability (need help adding 2 columns from another table)
High CPU Usage Alert-Email Template
Reports
95th Percentile Bandwidth Utilization using Netflow- IPGroups-Pxx1h
Alert & Action History
Alert when an agent is not communicating for 30 minutes
Bulk Import ICMP Nodes
Custom Dashboard - Rural Internet Service Provider - High Level NOC
Insert html tags into alert to post on MS Teams channel
Scripts
Acknowledged Alerts
Alert Email Settings
Automatically Change Interface Polling Interval (Automation)
Change credential set used by Windows nodes
Default Colors/Icons for Orion Statuses
Long Running Query Alert
Widgets
Active Alert Time Last 30 days
Alert Inventory SWQL Report
Check HardwareHealth Model and copy to LNE_Model Custom Property.
Create multiple User accounts in SolarWinds
External API O365 dashboard
FAQs
Low Disk Space Alert – HTML Email Template
Alert Acknowledgement Statistics - This Month
Alerts Event Type Actions Report
Check the AssetTag field and copy to the custom SerialNumber field.
Delete Nodes from Spreadsheet
F5 Load Balancer
Monthly Availability (Last 12 Months)
Alert Action - Email Assignments
All Nodes Drilldown Widget
Component Process Count over Threshold (Linux)
Delete Unneeded Volumes
Linux AIX UNIX dashboard
NCM Scheduled Jobs Timeline
Alert Active Time
Applications With Most Failed Checks
Custom Property Automation - Site/Country/Region
Disable All Out of the Box Alerts
Modern Drill-Down Dashboard
Orion Custom SWQL Query Search & Reference Table
Alert Trigger Counts
Asset Inventory: Linux Servers
Disable Legacy TLS (TLS 1.0 & TLS 1.1) - PowerShell Script
Force HA Failover when a certain percentage of SolarWinds Agent per polling engine reach an unknown state
Monitored Entities Needing Attention
Printable version of any View (Export to PDF)
Alerts, Reports, or Limitations are Utilizing a Custom Property
Asset Inventory: Network Devices (from NCM)
Export Alerts from SolarWinds Platform
Group Based Alert Based on Percentage of Group Members with a status that are not "green"
My simple drive performance dashboard
Show a view on the Group screen, where there is a view with the same name
All Configured Alerts Inventory Report
Asset Inventory: Network Interfaces
Export Custom Properties
Group has reached X% Members with Down status (SWQL)
NetPath Summary
SolarWinds Alert: Node Down- Email Template
All Defined Custom Properties
Asset Inventory: VMWare CI's for VCenter, Cluster, Data Center, Datastore, hosts and relationships
Export License Keys to CSV File
Network Compliance Summary [Deprecated]
New Synology DSM Version Available
Unmanage, Remanage, Mute, Unmute all members of a group with dropdown
All Defined Custom Properties (2023.3.0)
Asset Inventory: Windows Server
Export Modern Dashboard (Easy Way)
Network Dashboard
Orion Health - SNMP not working on APE
Using live graphs on summary pages
All Nodes Monitored for Network Configurations
CDP Neighbor Widget to replace previous legacy report
Export Orion Alerts
Networks Summary
Replacement High CPU Load Alert
World Clock (with Javascript)
All Unmanaged Nodes
Checking custom poller age for stale data (Temporary table, array, what's the difference?)
Find & Replace Community Strings (Read-Only and Read-Write)
Networks Summary - Alert Status
Set Preferred Polling Engine for Agents using Custom Property
All node report
Classic Dashboard Widget List (and Search)
Fix SAM PowerShell Remoting - 2022.4
Networks Summary - Hardware Status
Summary of Alerts Generated
All nodes
Component Count by App per Node
Generate an HTML Report of Interface Config Snippets using PowerShell
Networks Summary - Interface Status
Too many reboots by a Node
AppStack Relationship Report
Conditional email addresses within email actions SWQL query
Get Orion Server Versions
Networks Summary - Node Status
UnDP value change alert
Application Assignment
Current Node Status Summary
Get SWQL Queries from Modern Dashboard Widgets
Node Environment
Update Node Region (Custom Property) based on Caption
Application Availability Business Hours
Custom Chart Legend - Can it be hidden/removed
Get Web Pages for Monitored Entities
Node based YTD Availability Dashboard
Windows Service Restarter Alert
Assets Inventory For NPM
Custom Properties detected in Account Limitations
Import Modern Dashboard (Easy Way)
Overall Node Availability (Last 7 Days)
[Advanced] Thin AP Disappeared from WLC
Assigned Poller Report
Custom Properties detected in Actions (Reporting or Alerting)
Install Latest Orion SDK from Github (PowerShell)
Overall Node Status Dashboard
[Advanced] Thin AP Down
Availability based on Custom Property
Custom Properties detected in Alert Logic
Managing Orion Server Certificate Settings with PowerShell
Overall Status Breakdown - Nodes
SSL Certificate Expiration Alert
Average Availability Across All Nodes
Custom Properties detected in Dynamic Group Definitions
Mute interface due to Neighbor down and unmanaged
Orion server low disk space issues
Overall infra Dashboard
Backup Status by last backup date - Errors Only
Custom Properties detected in Report Definitions
NFS Stale Status
Polling Method Widget with Drilldown Link
Cisco Adaptive Security Appliance Remote Code Execution and Denial of Service Vulnerability (v3)
Custom Query Widget for node PowerShell Component Messages
PS1 EventID 1309 email alert if SolarWinds site fails to load
Servers Summary
Cisco Hardware report with Serial Numbers
Daily Platform Maintenance
Patching Machines (or Shut-up Alerts)
Servers Summary - API Poller Status
Cisco Reload Reason Report
Dynamic User Links
Perform List Resources and Auto Import Select Values
Servers Summary - Alert Status
Cloud License Details Report
Group Detail Page - Busiest Interfaces on group members
Practical Examples: Acknowledge Alert
Servers Summary - Application Status
Cloud-based Node Report
Group Membership (Node)
Practical Examples: Add Alert Note
Servers Summary - Server Status
Components Assigned to Node Filtered by Type
I am trying to run a report, but looks like the db tables changed recently
Practical Examples: Authenticate
Site Summary - Overview
Current Active Alerts by Name
ICMP Status Only vs. Paid Nodes for HCO Details | Older than v2022.3
Practical Examples: Export Alerts
Site Summary – Alert Status
Current users logged into Orion
IP Addresses Nearing Exhaustion
Practical Examples: Export Modern Dashboard
Site Summary – System Status
Custom Group Member Report with Node Information
IPAM Audit Events Widget
Practical Examples: Export Modern Dashboard [Better]
SolarWinds Active Alert Dashboard
Custom Property Impact Assessment
IPAM Information about a Node
Practical Examples: Import Alert
SolarWinds Active Alert Dashboard with Service now Incident number and URL
Custom Property Utilization
Insert html code into SQL query to show custom node availability
Practical Examples: Import Modern Dashboard
SolarWinds Agent Status Dashboard
Deletion Report
Interface Polling Issues
Practical Examples: Import Modern Dashboard [Better]
SolarWinds Agent dashboard
Dependencies Status Report
Interfaces Experiencing Packet Loss
Practical Examples: Mute Node
SolarWinds Alert - Execute an external Program- Failed
Device Port Inventory
Last 100 Events for a Node
Practical Examples: Set Interface to Unpluggable
SolarWinds Modern Dashboard Table Widget Agent Status Base
Disks Approaching 100% Capacity This Month
Last 100 Logs for a Node
Practical Examples: Unmanage Node
SolarWinds Orion Platform Status Overview
Down nodes - demo report
List of Maps
Practical Examples: Update Node Custom Properties
SolarWinds Web Terminal(SSH) Dashboard
Enabled Alert Query Details
Logs, SysLogs and Traps on Node Details Page
Practical Examples: Update Polling Cycle
Storage Dashboard
Events for the Last 15 Days
Maintenance View - Device Model & Firmware Counts - Cisco
Python Script to Enable/Disable Application Components
Team Summary Dashboard
FGT LV2 Utilization
Maintenance View - Device Model Counts - Cisco
Python Script to create, update and assign credentials used for polling
URL SSL certificate
Get all SVIs with their IP addresses & Descriptions (need NCM)
Maintenance View - Device Stats - Cisco
Reboot a Node using Agent service (for Alerts)
Vitualization Overview
Ghost & Unknown Interface Report
Map Membership (Nodes)
Register Passive Agents to SolarWinds Platform
Windows Dashboard
Global Suppressed Alerts Dashboard
Group Member Availability Report (Hourly/Daily/Monthly)
Maps containing Node (Node Details)
Remove Domain and Capitalize Node Captions
Group Member Availability Report for Interfaces (Hourly/Daily/Monthly)
Modern Dashboard - User Links
Remove Interfaces in bulk (by filters or added date)
Group Members - Nodes
Modern Dashboard List (and Search)
SCM "Fix-fim"
Group SLA Info
Multi-Statistic Data (Script Components) and pivot example
SQL Server Scripts for Index Analysis and Tuning
HARDWARE HEALTH ENABLEMENT REPORT - Web Based
NCM Backup Job Config Status
Script to change an Interface's polling interval (Used with alerting)
Historical Alerts - Last 24 Hours
NCM Outdated Config Backups
Set Classic Dashboards to Equal Column Widths
Historical Triggered Alerts for the Last 7 Days
NCM Scheduled Job Durations
SolarWinds Agent reprovisioning script for Linux devices
Hybrid Cloud Observability License Summary Report (Legacy)
NTA Query - Endpoint has traffic
SolarWinds IIS Summary View Log Parser
ICMP Status Only vs. Paid Nodes report (Hybrid Cloud Observability Only)
NTA: Number of flows per Device/per Interface
SolarWinds Report Exporter - Tested with SolarWinds Platform 2023.2
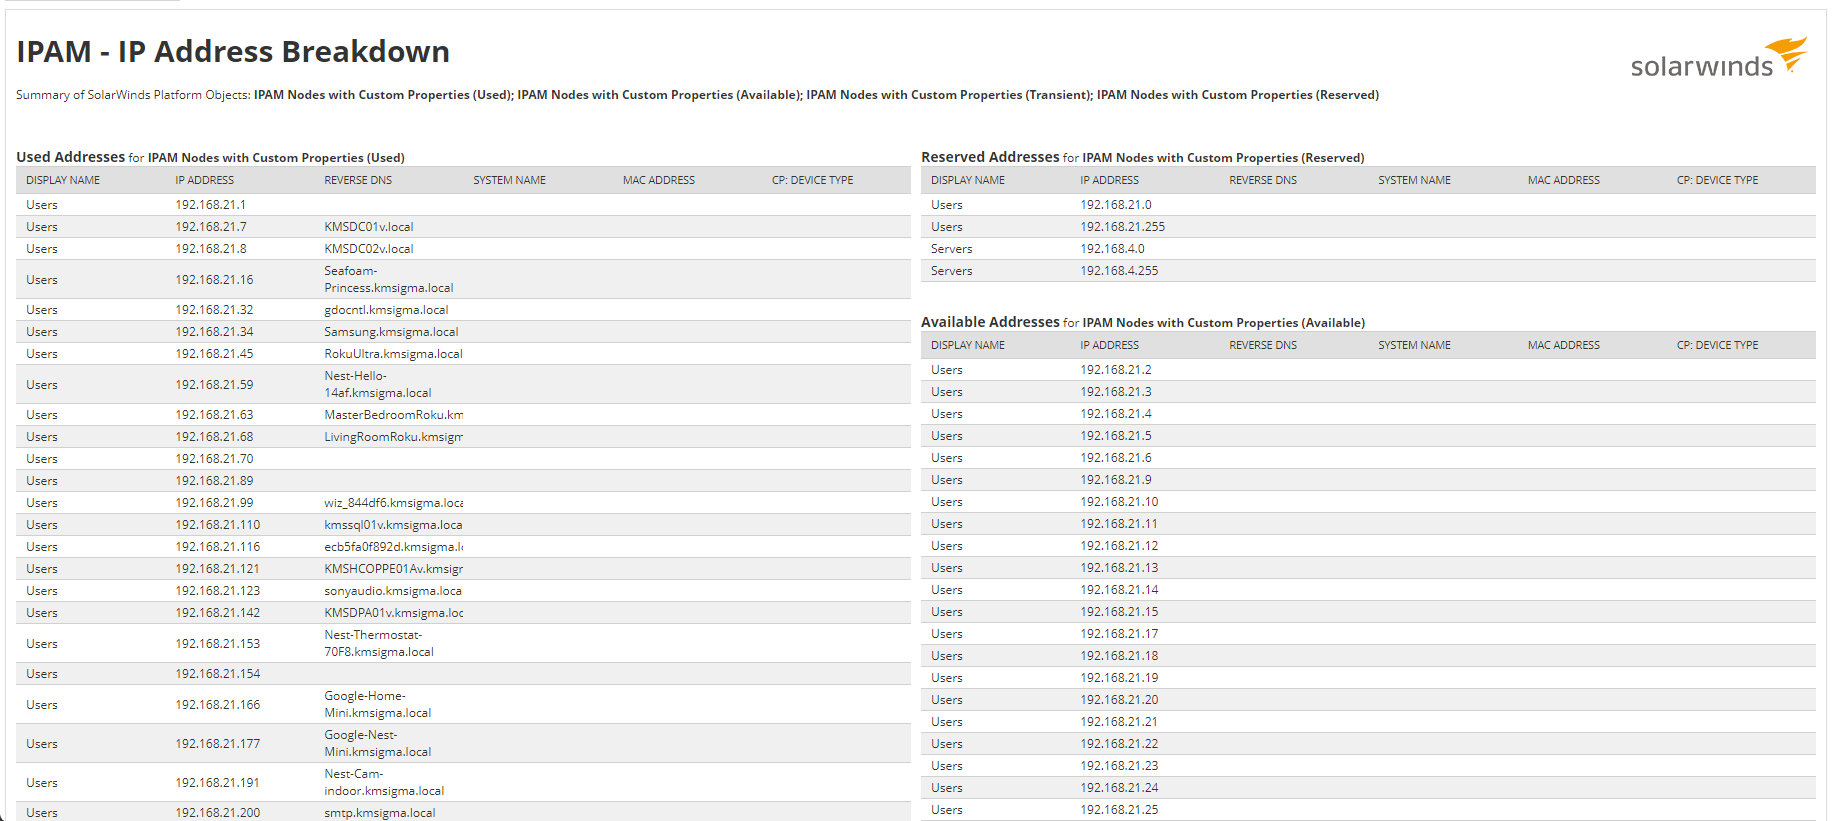
IPAM - IP Address Breakdown
Node Level Events
SolarWinds agent reprovisioning script with certificate field for windows machines
IPAM - Recent IP Status Changes
Node application component assigned credentials SWQL query
Some Functions for Working with Custom Properties
IPAM - Unscanned subnets
Node assigned credentials SWQL query
Telegram Bot for SolarWinds Monitoring
Identify UNDP pollers that have 'No Data' values
Node enabled pollers query
Test a Port on a Remote Machine
Interface Circuit Issues - Last 30 Days. CRC Align, Late Collision Report
Nodes With High CPU & Memory Usage
UI for scheduling nodes to maintenance using SolarWinds REST API and Python
Interface Count Monitored by Node Name
Nodes Without Recent Polling
Unmanage Nodes as part of Alert Action
Interface Count by Node Name
Orion HA Failover Details
Unmanage or Suppress Alerts (Applications)
Interface created Today Database query
Orion agent plugin details
Update Agent Node to new Polling Engine
Interfaces by Site
Query Alert Captions that don't match real Entity Captions
Update Node Captions to match polled Sysname value.
Last 1000 Audit Delete Events
Query Orion Views
Upload Custom Properties
Last Month's Interface Availability Report, Including % available, up and down time
Query date template assigned node SAM (SQL)
WMI assigned Nodes
Legacy Report Migration - List Views Using Legacy Reports
Query for agent info source via the agent tables
Workaround - Oracle .Net Framework Data Provider Error
List of Reports
Query for agent status and response time pollers enabled and disabled
importReports.ps1
Map Summary Report (Nodes)
Query last 7 days of alert email action history in SWQL
SWQL Powershell Create account
Monthly summary of all device bandwidth
Query nodes down with the most recent note and last time seen up
Muted Element Report
Query nodes failing to poll via their configured polling technology
NCM Backup Failures and Reason (- All Clients)
Query to get the Muted Elements in Orion
NCM Report - "Number of Configs per Device in NCM"
Routing Neighbors for a Single Node
Node Availability - This Year
Run a query about licensed component monitors in SAM
Node Availability Report (By 'Nines')
SAM Application Widget to simplify Application editing and searching from a single Dashboard Widget
Node Availability Report (Up / Down)
SAM Simple Display of MultipleStatisticData Values
Node Status vs Node Polling Method Report
SQL Advanced Find/Replace within email alert actions
Node and Interface Capacity Report
Search Nodes by Name, IP etc - widget
Node outages for the last day with duration
Simple Custom Property Widget
Nodes Down During Time Range Report
SolarWinds/Orion Map Inventory
Nodes Orion Can't poll
Switch Stacks with Problems
Nodes Running Uptime Report
Syslog & Trap widgets for Node & Interface Details Views
Nodes with Descendants
Top 10 Nodes by Latency (Last 1 Hour)
Nodes with Missing WMI CPU&Memory Pollers
Translate date from API returned as Day Mon DD HH:MM:SS TZN YYYY (Cisco ISE) and display color coded
Noisy Alert - Understanding which alerts and nodes are the noisiest and general alert config best practice
Unmanaged & Muted Nodes (with a Node Custom Property Filter]
Non-Default Polling Rates
Unmanaged Nodes with custom names
Number of VMs per vCenter
VM's not monitored by SolarWinds as Nodes
Orion NPM HW HEALTH REPORT FOR NODES WITHOUT SENSORS
Volume Utilization with Forecast Capacity
Orion Polling Engine Load
Widget: NetFlow Usage Per Polling Engine Query
Orion Polling Engine Report
Widget: Node Status Root Cause
Orion Threshold Report (All Thresholds)
Widget: Node Status vs. Node Polling Method Widget (Node Details)
Orion Threshold Report (Custom Thresholds Only)
Widget: VMAN ESX Host Alarms From vCenter
Out of the Box Alerts
return unknown volumes with delete command
Parent/Child Depency Report
widget - discovery status by polling engine
Performance Serveur bmce-ws-prod
Widget - Node Details Server Resource Polling
Physical Server Inventory Report
Widget - Node Details Cisco resource polling
Detecting Cisco devices that aren't backed up
Public Cloud Tags Report
Query to display Duplicate Caption names
Reboots and Downtime Report (Last 7 Days)
Repetitive Email Alerts (Noise) - MUST HAVE REPORT!!!
Report Used for Exporting Nodes from Orion
Report for Lightweight APs on Cisco Controllers using Custom Pollers (UnDP)
Report shows all Orion dependancies
Report: All Active Alerts with Acknowledge action
Resources Dependent upon Custom Properties
Response Time vs Packet Loss Last 30 Days
SAM Application Usage and Polling Frequency Report
SCM SQL Reports - Content Data
SNMP Trap Sources Report
SNMP traps from SQL query example
SQL Database File IOPS
SQL Jobs
Scheduled Reports
Self-Hosted Observability License Summary Report
Serial Number report with various applicable OIDs
Server Memory & CPU Report (by Manufacturer/Model)
Server Report
Simple All Interfaces Report
Software Inventory by Node
SolarWinds Account Report for Import
SolarWinds Orion Accounts
SolarWinds Platform Licensing/Polling Usage Report
Switch Stack Membership
Syslog Sources Report
Syslog from Unknown devices
Syslog from unknown devices report
Top 10 Errors and Discards with Percentages
Top 10 Expensive Queries
Top SNMP-Trap Senders
Top Syslog Senders
Total Nodes, Volumes, Interfaces, NCM Licensed Nodes and UDT Ports Used by Group
Traps from unknown devices report
Triggered Alert History - Last 30 Days
UnDP Custom Poller Utilization
Unknown Application Components in Error
Unknown Volumes Report
User Role Delegation
VMs Not Monitored In SolarWinds Orion (Exported Report) - Prosperon Networks
VMware Host Disks
VMware Inventory Report
Virtual Cluster Historical CPU Load using dynamic threshold data
Virtualization Manager - All Datastores
Volume Count by Node Name
Volumes with disc usage above 95%
Weighted Average Availability
When Was Database Maintenance Last Performed (Exported Report) - Prosperon Networks
Windows Credential Report (Web-Based)
Windows Event Details for a Specific Component Name
Windows Event Log Report
Windows Event Logs Report
Wireless Client Connection Report
Yesterday's Windows Error And Warning Events
[Report] Devices Not Responding To SNMP, WMI Or Agent Queries
Acknowledged and Cleared Alerts Report
How to generate a report from SolarWinds for all deleted devices (nodes, interfaces, volumes, etc.)
Test subject tiff
IPAM - IP Address Breakdown
IPAM+-+IP+Address+Breakdown.xml
Build in response to
IPAM Report with Custom Property
.