Purpose
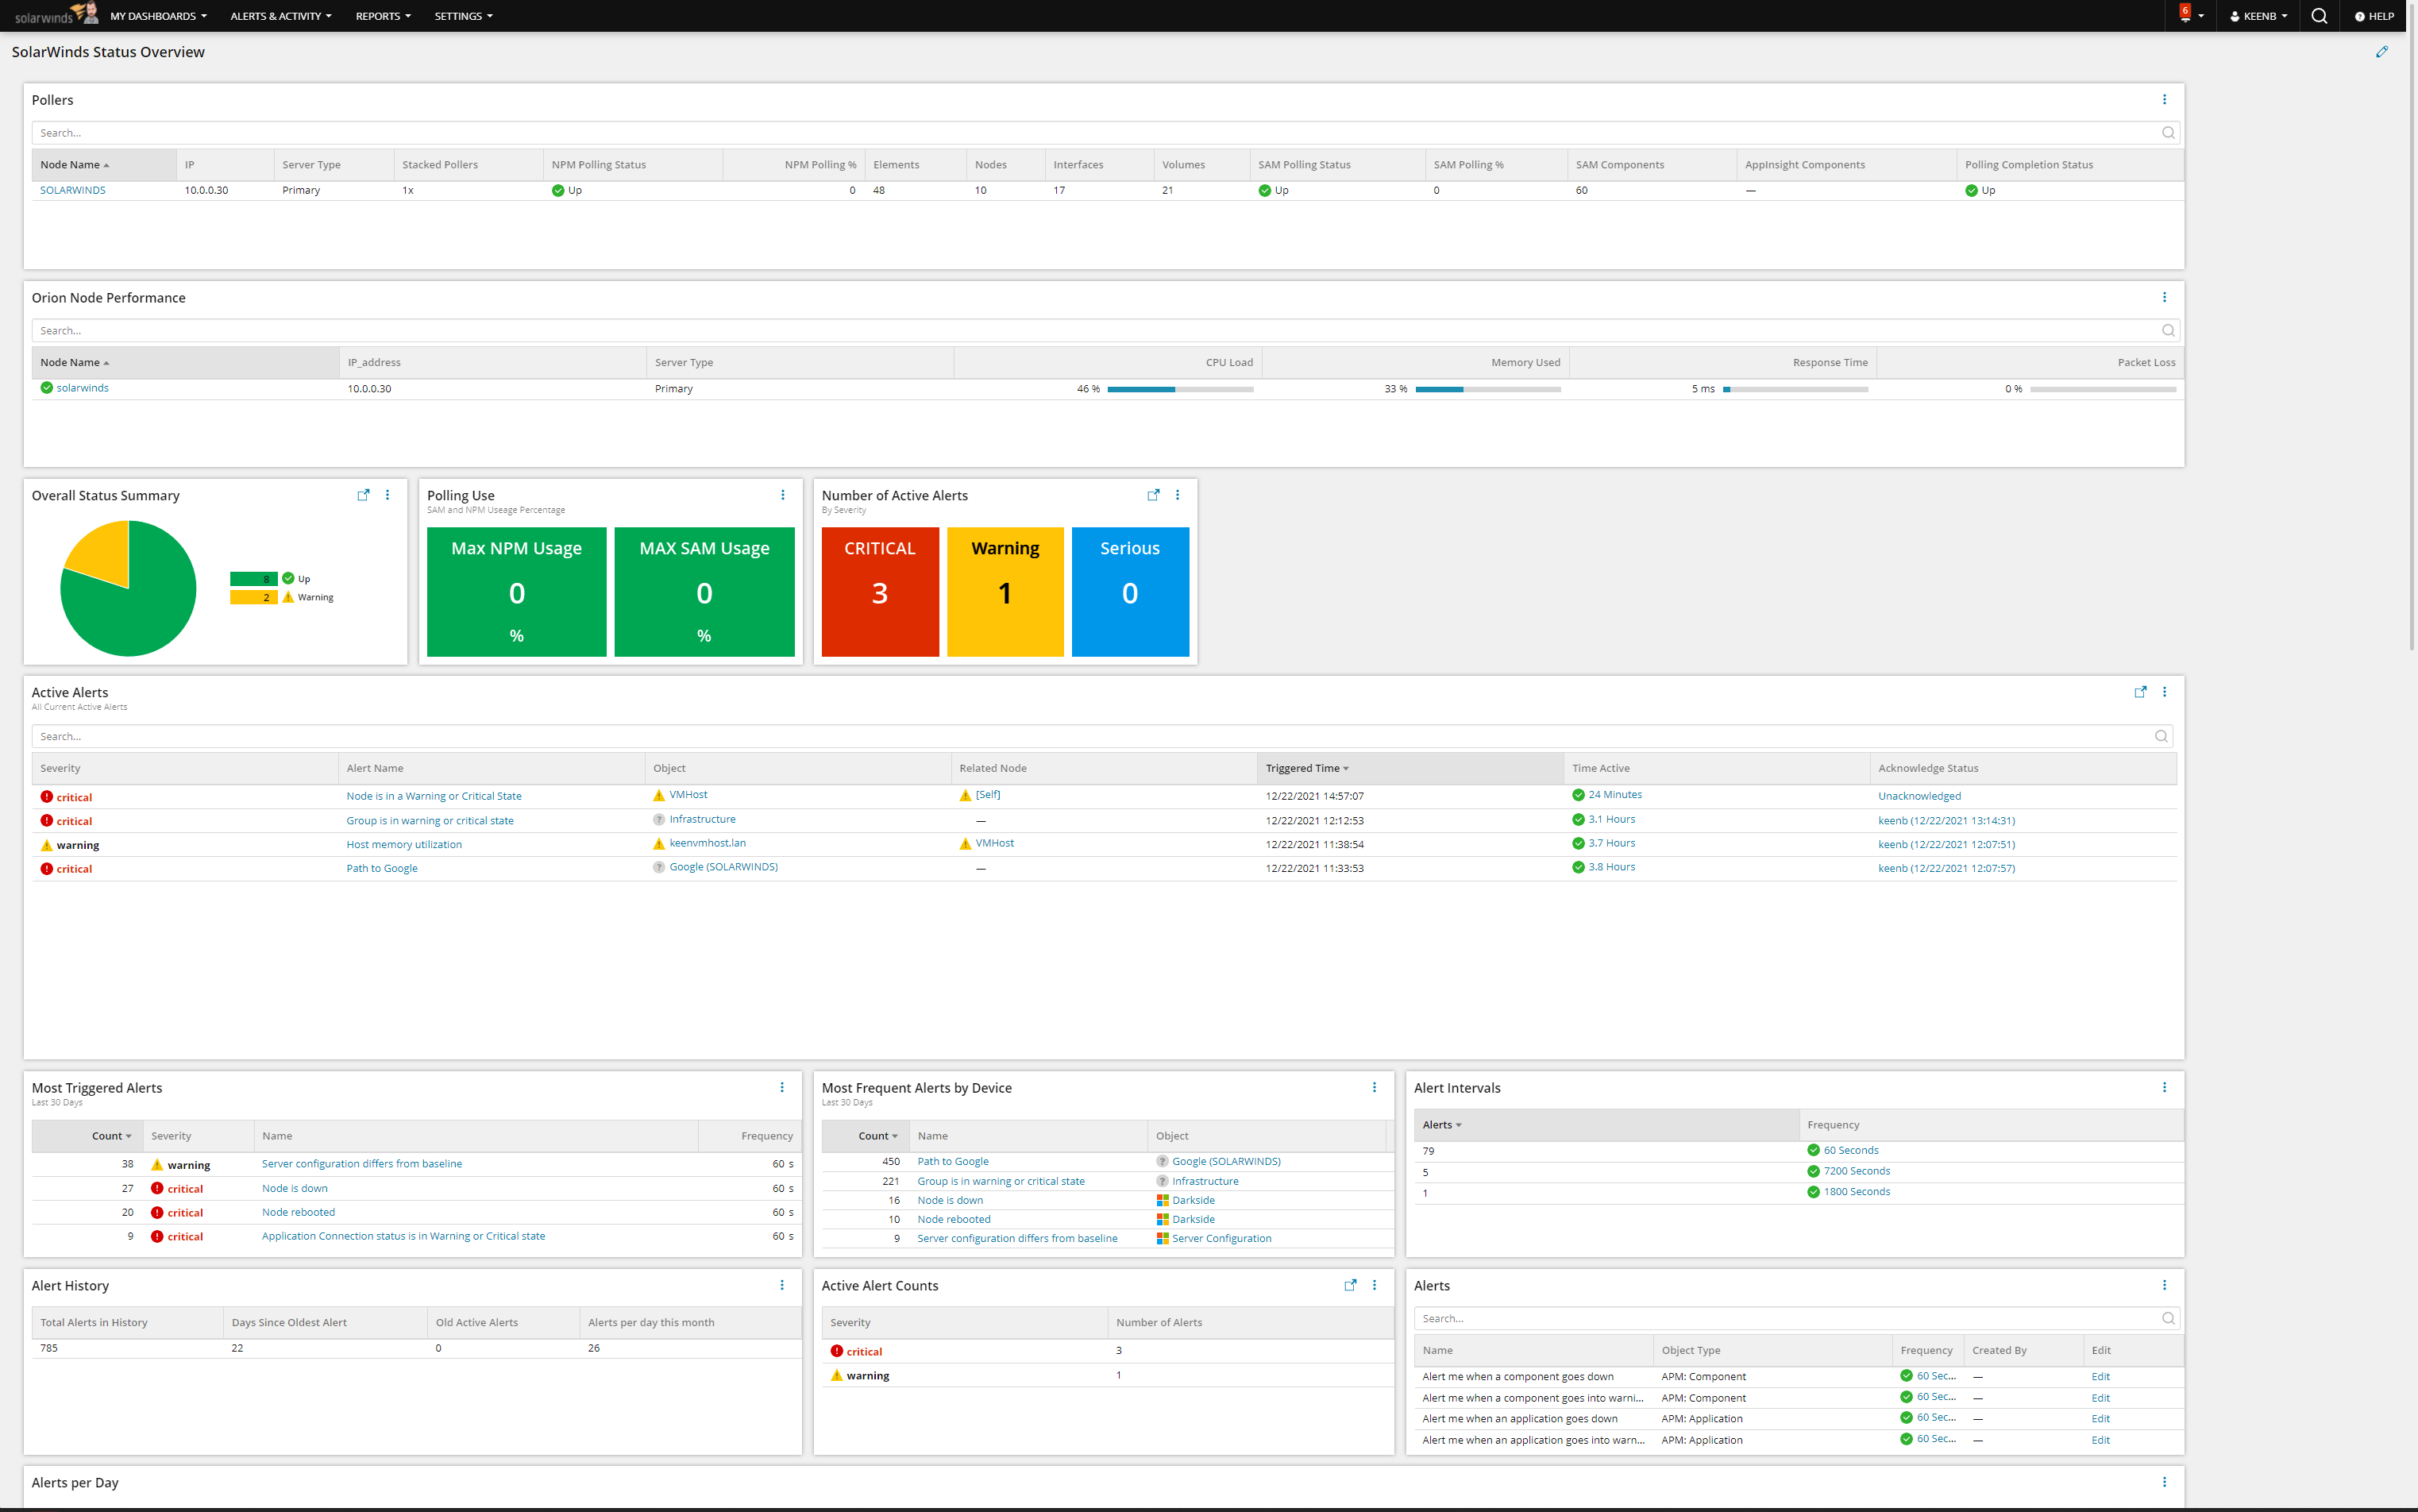
To show Monitoring Engineers/Admins a high-level overview of what is happening within their monitoring environment.
Custom Properties Required
Orion Platform Version:
Features
- Overall Environment Summary
- Highest NPM/SAM Usage Percentage
- Poller Information Status and Performance details
- Quick Credential Lookup
- Polling details
- Alert History and Details
- Nodes/Volumes/Interfaces with Polling issues details
- Polling Intervals
- Quick Custom Threshold Lookup
Contributors
How to add the dashboard
Special Notes
- Some of the widgets link out to other Modern Dashboards such as the Alert Dashboard which can be found on this content exchange as well.
Version History
| Version | Date | Changes/Updates |
|---|
| 1.0 | 2021-10-28 | Initial Release |
| 2.0 | 2021-11-09 | - New layout
- New Alert Widget allows you to acknowledge the alert directly from the widget
- Improved "Noisy Alert" widgets
|
| 2.5 | 2021-12-22 | - Updated URL links to make use within any environment better
- Add Number of Alerts by Severity KPI Widget
- Improved date display on "Alerts per Day" widget to only show Month and Year rather than a long timestamp.
|