SolarWinds THWACK
THWACK
  • Sign In
  • Search
  • Product Forums
    • Observability
      • SolarWinds Observability
      • Hybrid Cloud Observability
      • DevOps
    • The Orion Platform
      • Forum
      • Scalability Engines (HA, APE, AWS)
      • Enterprise Operations Console (EOC)
      • Orion SDK
      • Alert Lab
      • Report Lab
    • Network Management
      • Network Performance Monitor (NPM)
      • NetFlow Traffic Analyzer (NTA)
      • Network Configuration Manager (NCM)
      • IP Address Manager (IPAM)
      • User Device Tracker (UDT)
      • VoIP & Network Quality Manager (VNQM)
      • Log Analyzer
      • Engineer’s Toolset
      • Network Topology Mapper (NTM)
      • Kiwi CatTools
      • Kiwi Syslog Server
      • ipMonitor
    • Systems Management
      • Server & Application Monitor (SAM)
      • Virtualization Manager (VMAN)
      • Storage Resource Monitor (SRM)
      • Server Configuration Monitor (SCM)
      • SolarWinds Backup
      • Web Performance Monitor (WPM)
    • Database Management
      • Database Performance Analyzer (DPA)
      • SQL Sentry
      • Database Performance Monitor (DPM)
      • Database Mapper
      • Task Factory
    • Application Management
      • AppOptics
      • Loggly
      • Papertrail
      • Pingdom
      • DevOps
    • IT Security
      • Access Rights Manager (ARM)
      • Identity Monitor
      • Security Event Manager (SEM)
      • Patch Manager
      • Serv-U FTP & MFT
    • IT Service Management
      • SolarWinds Service Desk (SWSD)
      • Web Help Desk (WHD)
      • DameWare Remote Support (DRS)
      • DameWare Remote Everywhere (DRE)
      • DameWare Mini Remote Control (MRC)
  • Resources
    • THWACK Command Center
    • DevOps
    • What We're Working On
    • Blogs
      • Community Announcements
      • Product Blog
      • Monitoring Central
      • Geek Speak
      • The DevOps Blog
    • THWACK Tech Tips
    • TechPod
    • Support
      • Success Center
      • Documentation
      • Submit a Support Ticket
      • Customer Portal
      • Renew Maintenance
    • Community Groups
      • New To THWACK
      • Federal & Government
      • User Experience
      • EMEA Group
      • Japan Group
  • Events, Missions, & Musings
    • Events
      • THWACK Livecast
      • THWACK Livecast Archive
      • SolarWinds Lab
      • SolarWinds Lab Archive
      • THWACKcamp 2022 On Demand
      • SolarWinds User Groups
      • SolarWinds Events Calendar
    • Missions & Contests
      • Monthly Mission: What Killed Your Productivity?
      • THWACK 101
    • Musings
      • Water Cooler
      • Geek Tank
      • IT Tech Jobs/Careers
      • Monitoring for Managers
    •  
      •  
  • Content Exchange
    • The Orion Platform
      • Alerts
      • Custom HTML
      • Custom Queries
      • Modern Dashboards
      • Reports
      • Scripts
    • Network Performance Monitor
      • Device Pollers
      • Universal Device Pollers (UnDP)
    • Network Configuration Manager
      • Config Change Scripts
      • Device Templates
      • Firmware Upgrade Templates
      • Policy Documents
    • Server & Application Monitor
      • API Pollers
      • Application Monitor Templates
    • Server Configuration Monitor
      • Policies
      • Profiles
    • Database Performance Analyzer
      • Custom Alerts
      • Custom Metrics
      • Custom Queries
    • Web Help Desk
      • Style Sheets
  • Academy
    • Newsroom
    • Forums
      • Classroom Discussions
      • SolarWinds Certified Professional (SCP)
    • Training & Certification
  • Free Tools & Trials
  • Store
The Orion Platform
  • Content Exchange
  • More
The Orion Platform
Modern Dashboards SolarWinds Active Alert Dashboard
  • Tags
  • More
  • Cancel
Options
  • View all
  • Previous
  • Next
  • View slideshow
  • More
  • Cancel
fileName

SolarWinds Active Alert Dashboard

Alert Dashboard

Purpose:

To provide a detailed view of your alerts in easy-to-understand widgets.

Required Custom Properties:

None

Features:

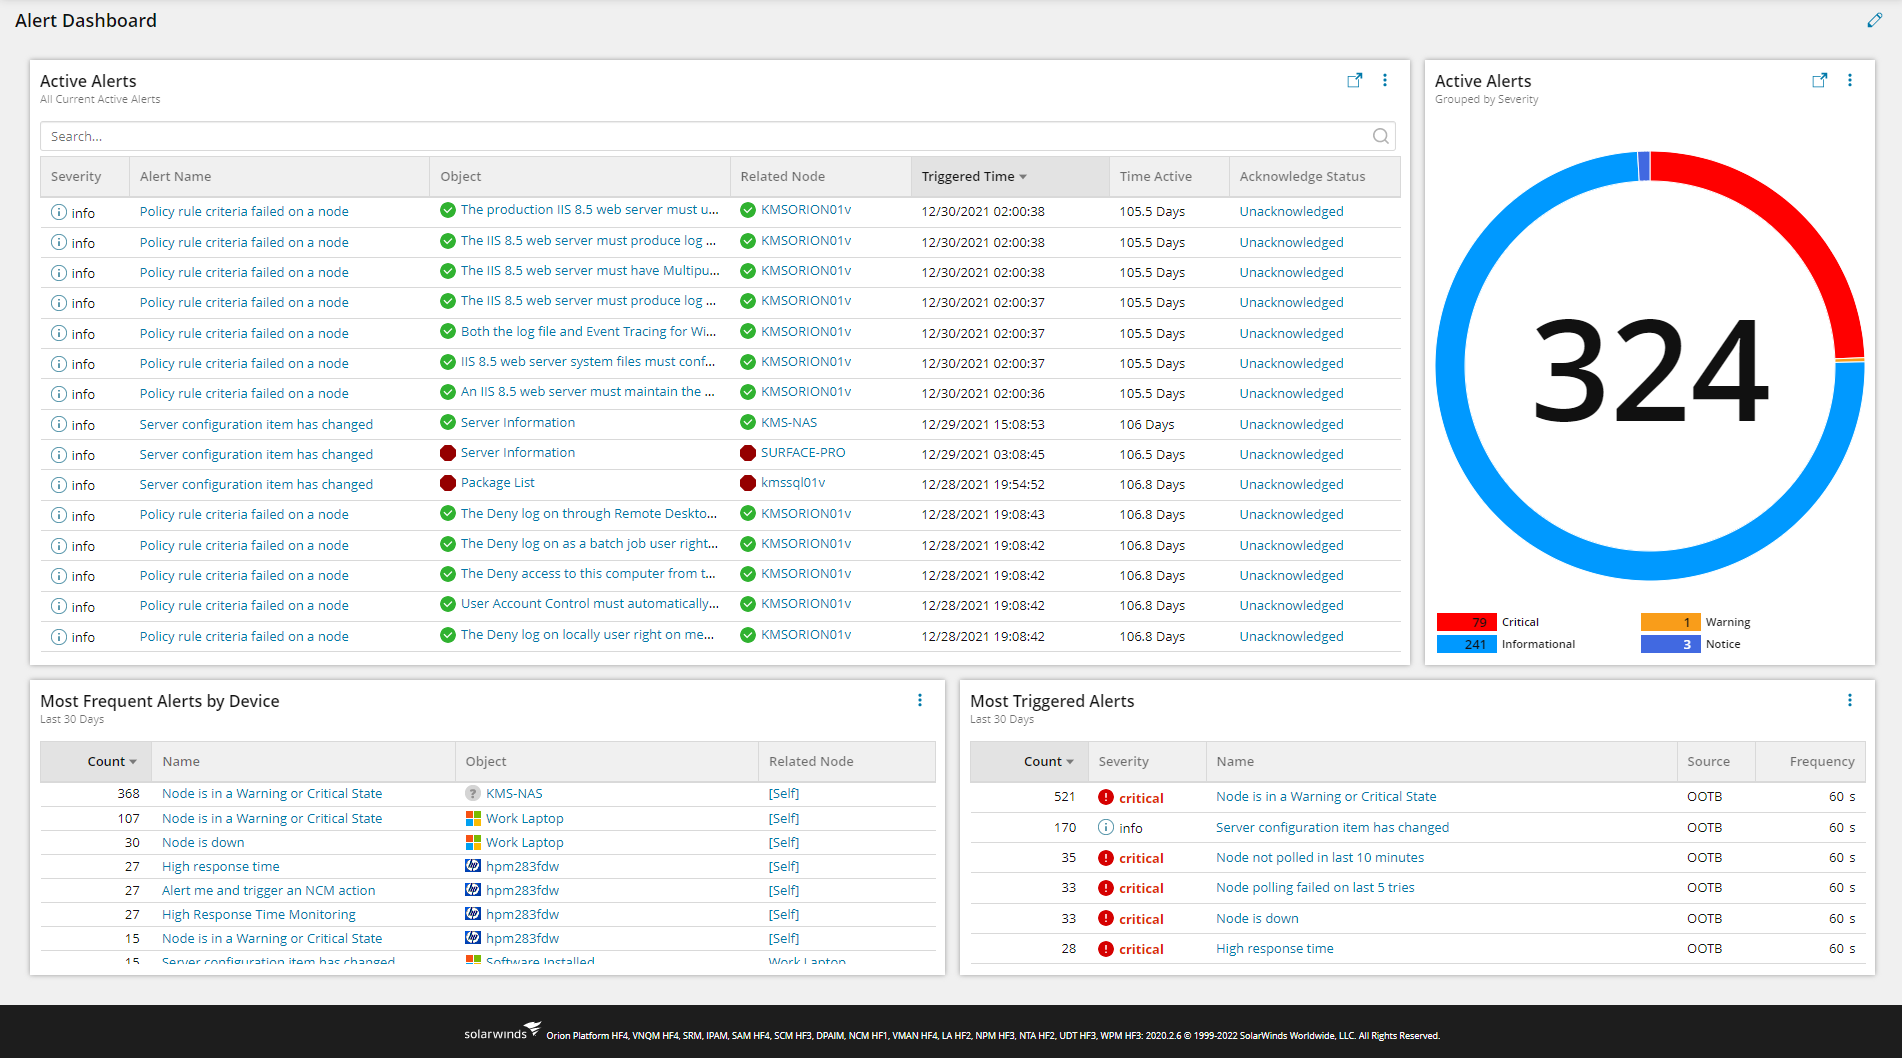
  • List of all active alerts, the element that is causing the alert, the related node, when the alert triggered, and how long it's been triggered
  • Acknowledge the alert directly from the widget by clicking on "Unacknowledged"
  • Once acknowledged, the widget will show the user and timestamp of when the alert was acknowledged
  • List of "Noisy alerts" for the past 30 days.

Contributors

  • KMSigma

How to add the dashboard

  • Download the JSON file and then you can refer to this article from KMSigma on how to import the JSON.

Version History

Version Date Changes/Updates Author
1.0 2021-11-09 Initial Release the_ben_keen
1.1 2022-04-13
  • Added new column for Most Triggered Alerts table to show if they are "out of the box" or "Custom" alerts
  • Added donut widget with breakdown of active alerts by severity.
KMSigma
  • Alert
  • Orion 2020.2.6
  • Server & Application Monitor (SAM)
  • Network Performance Monitor (NPM)
the_ben_keen
the_ben_keen
  • 9 Nov 2021
  • 399 Downloads
  • Share
  • More
  • Cancel
Anonymous
  • KMSigma
    KMSigma 11 days ago in reply to vutuan1510

    You can change the underlying SWQL queries.  In fact, the detail about the filtering is listed in the comments near the end of the query (at least for the table element):

    ------------- Begin Snippet -------------
    -- Mandatory JOINS needed if you want to filter via nodes custom properties
    --LEFT JOIN Orion.NodesCustomProperties AS [NodeCP]
    --  ON [AlertObjects].RelatedNodeID = NodeCP.NodeID
    --LEFT JOIN Orion.Nodes AS [Nodes]
    --  ON [AlertObjects].RelatedNodeID = Nodes.NodeID
    WHERE [AlertObjects].AlertActive.AlertActiveID > 0
    -- AND [AlertObjects].Node.CustomProperties.[CP_Name] = 'CP_Value'
    -------------- End Snippet --------------

    • Cancel
    • Up 0 Down
    • Reply
    • More
    • Cancel
  • vutuan1510
    vutuan1510 18 days ago

    Hi all, i want to filter Alert by Nodes custom properties (City = London). how can do that ?

    • Cancel
    • Up 0 Down
    • Reply
    • More
    • Cancel
  • KMSigma
    KMSigma 1 month ago in reply to harrygos

    Look in the Orion.AlertHistory entity in SWQL.  For more questions like this, you should ask in the Orion SDK forum.

    • Cancel
    • Up 0 Down
    • Reply
    • More
    • Cancel
  • KMSigma
    KMSigma 1 month ago in reply to sadiqsul

    The query is in line 812 of the above code sample.

    • Cancel
    • Up 0 Down
    • Reply
    • More
    • Cancel
  • harrygos
    harrygos 1 month ago

    i'm trying to add the trend of the alert in graphical representation . please suggest can i use the time series data to do it ?

    • Cancel
    • Up 0 Down
    • Reply
    • More
    • Cancel
>

SolarWinds solutions are rooted in our deep connection to our user base in the THWACK® online community. More than 190,000 members are here to solve problems, share technology and best practices, and directly contribute to our product development process.

SolarWinds Customer Success Center Certification SolarWinds Lab Link Accounts
About THWACK Blogs Federal & Government Edit Settings Free Tools & Trials
Legal Documents Terms of Use Privacy California Privacy Rights Security Information
©2021 SolarWinds Worldwide, LLC. All Rights Reserved.