SolarWinds THWACK
THWACK
  • Sign In
  • Search
  • Product Forums
    • Observability
      • SolarWinds Observability
      • Hybrid Cloud Observability
      •  
      • New on THWACK DevOps
    • The Orion Platform
      • Forum
      • Scalability Engines (HA, APE, AWS)
      • Enterprise Operations Console (EOC)
      • Orion SDK
      • Alert Lab
      • Report Lab
    • Network Management
      • Network Performance Monitor (NPM)
      • NetFlow Traffic Analyzer (NTA)
      • Network Configuration Manager (NCM)
      • IP Address Manager (IPAM)
      • User Device Tracker (UDT)
      • VoIP & Network Quality Manager (VNQM)
      • Log Analyzer
      • Engineer’s Toolset
      • Network Topology Mapper (NTM)
      • Kiwi CatTools
      • Kiwi Syslog Server
      • ipMonitor
    • Systems Management
      • Server & Application Monitor (SAM)
      • Virtualization Manager (VMAN)
      • Storage Resource Monitor (SRM)
      • Server Configuration Monitor (SCM)
      • SolarWinds Backup
      • Web Performance Monitor (WPM)
    • Database Management
      • Database Performance Analyzer (DPA)
      • SQL Sentry
      • Database Performance Monitor (DPM)
      • Database Mapper
      • Task Factory
    • Application Management
      • AppOptics
      • Loggly
      • Papertrail
      • Pingdom
      •  
      • New on THWACK DevOps
    • IT Security
      • Access Rights Manager (ARM)
      • Identity Monitor
      • Security Event Manager (SEM)
      • Patch Manager
      • Serv-U FTP & MFT
    • IT Service Management
      • SolarWinds Service Desk (SWSD)
      • Web Help Desk (WHD)
      • DameWare Remote Support (DRS)
      • DameWare Remote Everywhere (DRE)
      • DameWare Mini Remote Control (MRC)
  • Resources
    • THWACK Command Center
    • New on THWACK DevOps
    • What We're Working On
    • Blogs
      • Community Announcements
      • Product Blog
      • Monitoring Central
      • Geek Speak
      •  
      • New on THWACK DevOps
    • THWACK Tech Tips
    • TechPod
    • Support
      • Success Center
      • Documentation
      • Submit a Support Ticket
      • Customer Portal
      • Renew Maintenance
    • Community Groups
      • New To THWACK
      • Federal & Government
      • User Experience
      • EMEA Group
      • Japan Group
  • Events, Missions, & Musings
    • Events
      • THWACK Livecast
      • THWACK Livecast Archive
      • SolarWinds Lab
      • SolarWinds Lab Archive
      • THWACKcamp 2022 On Demand
      • SolarWinds User Groups
      • SolarWinds Events Calendar
    • Missions & Contests
      • Mission: The Tech of Tomorrow
      • THWACK 101
    • Musings
      • Water Cooler
      • Geek Tank
      • IT Tech Jobs/Careers
      • Monitoring for Managers
    •  
      •  
  • Content Exchange
    • The Orion Platform
      • Alerts
      • Custom HTML
      • Custom Queries
      • Modern Dashboards
      • Reports
      • Scripts
    • Network Performance Monitor
      • Device Pollers
      • Universal Device Pollers (UnDP)
    • Network Configuration Manager
      • Config Change Scripts
      • Device Templates
      • Firmware Upgrade Templates
      • Policy Documents
    • Server & Application Monitor
      • API Pollers
      • Application Monitor Templates
    • Server Configuration Monitor
      • Policies
      • Profiles
    • Database Performance Analyzer
      • Custom Alerts
      • Custom Metrics
      • Custom Queries
    • Web Help Desk
      • Style Sheets
  • Academy
    • Newsroom
    • Forums
      • Classroom Discussions
      • SolarWinds Certified Professional (SCP)
    • Training & Certification
  • Free Tools & Trials
  • Store
The Orion Platform
  • Content Exchange
  • More
The Orion Platform
Reports Reboots and Downtime Report (Last 7 Days)
  • Tags
  • More
  • Cancel
Options
  • View all
  • Previous
  • Next
  • View slideshow
  • More
  • Cancel
fileName

Reboots and Downtime Report (Last 7 Days)

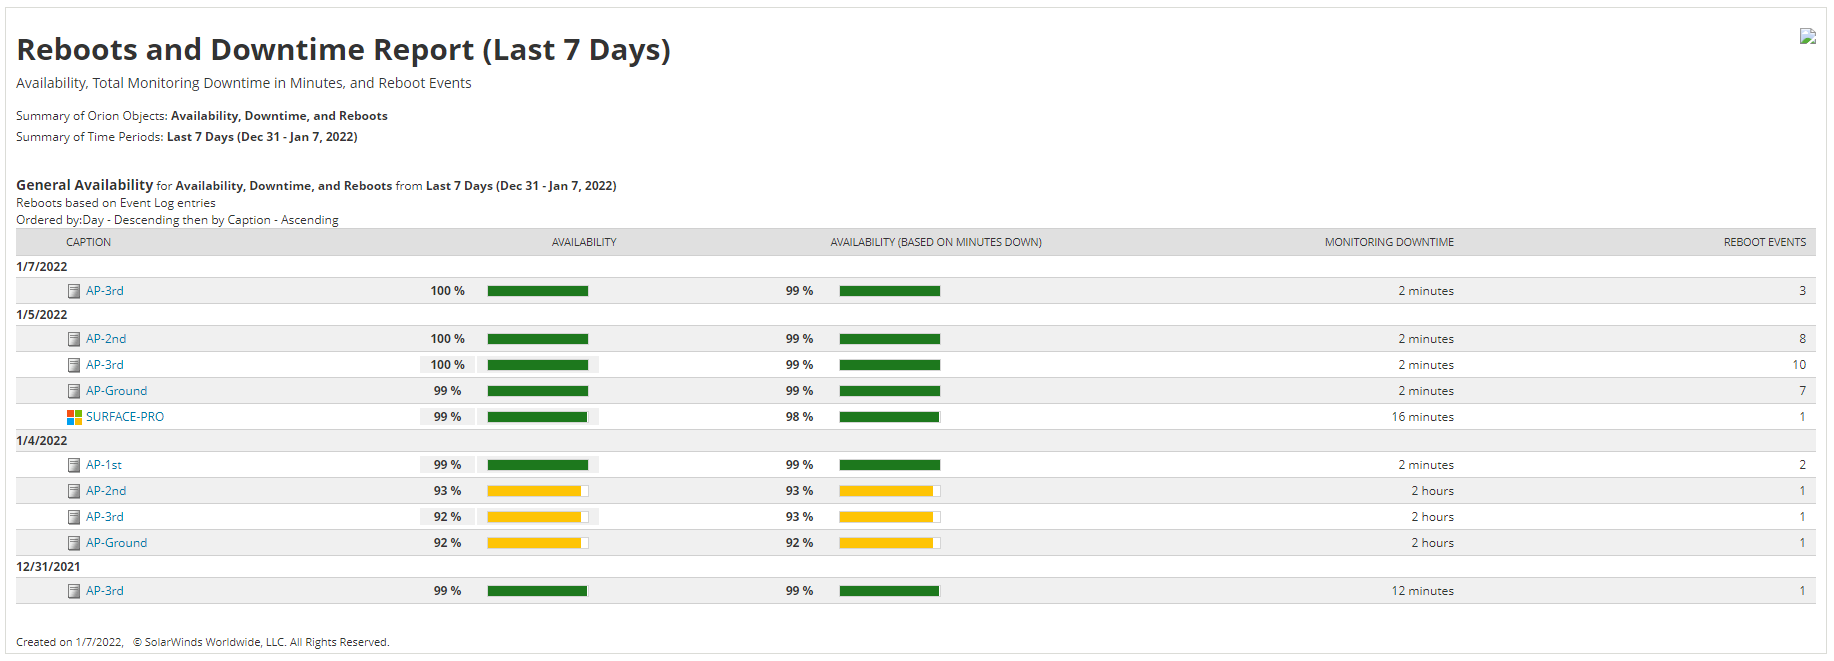
Updated to include Availability from Orion.ResponseTime, calculated Availability (based on minutes down from Orion.NetObjectDowntime), and the number of 'Node rebooted' events from Orion.Events.

It was inspired by a question posted on the Network Performance Monitor (NPM) Forum.

There is plenty of details in the query about how the information was calculated.  There's also a mention (commented out) on how to add filters for Node-based custom properties.

Important Note:

There will be a discrepancy between Availability and the Calculated Availability.  This is based on the polling cycles, the pollers being used, and the way data is stored in the database.  I (personally) prefer the Calculated Availability because it isn't limited to ICMP tests only.

  • Availability
  • Orion 2020.2.6
  • reboots
  • Network Performance Monitor (NPM)
KMSigma
KMSigma
  • 6 Jan 2022
  • 164 Downloads
  • Share
  • More
  • Cancel
Anonymous
  • patriot
    patriot 5 months ago

    Nice combination report. I would need this in daily, weekly, and for calendar month as well. Also, would need to be able to filter to only include nodes with a true value for a custom property. Can you help with these additional requirements?

    • Cancel
    • Up 0 Down
    • Reply
    • More
    • Cancel
  • KMSigma
    KMSigma 7 months ago in reply to Jovetic1981

    BTW - if they are scheduled Unmanaged then polling stops 100% and the platform has no idea if they are or are not "up."

    However, if they are "muted" then the polling still happens and should get flagged as being offline.  The way I understand it when an element is "Muted," the polling still occurs and the alerts still trigger, but the "trigger actions" in the alerts (like sending an email or writing a log) do not take place.

    • Cancel
    • Up 0 Down
    • Reply
    • More
    • Cancel
  • Jovetic1981
    Jovetic1981 7 months ago in reply to KMSigma

    These servers have been offline a few times.  I reboot them to patch, they have unscheduled main happen. They are agent based devices. Stumped.  but thanks for getting back to me.

    • Cancel
    • Up 0 Down
    • Reply
    • More
    • Cancel
  • KMSigma
    KMSigma 7 months ago in reply to Jovetic1981

    Point of clarity:

    "It's not pulling data for any servers that are online" - You mean ones that are online but have never been offline - because it should.  The Orion.NetObjectDowntime entity only records downtime - so anything that's always been up won't have data in that entity - hence no records in the final report.

    If you instead want an "uptime" report - or a 5-9's or something like that, then that'll rely on a slightly different query.  I build this one specifically for Nodes that have been down at some point.

    • Cancel
    • Up 0 Down
    • Reply
    • More
    • Cancel
  • Jovetic1981
    Jovetic1981 7 months ago in reply to KMSigma

    Yeah,  If i remove the line below it pulls back my servers that are currently deallocated, but is not pulling data for any servers that are online.

    AND [SI].StatusName = 'Down' -- Where the status is 'Down' (not 'Critical', 'Warning', etc.)

    • Cancel
    • Up 0 Down
    • Reply
    • More
    • Cancel
>

SolarWinds solutions are rooted in our deep connection to our user base in the THWACK© online community. More than 180,000 members are here to solve problems, share technology and best practices, and directly contribute to our product development process.

SolarWinds Customer Success Center Certification SolarWinds Lab Link Accounts
About THWACK Blogs Federal & Government Edit Settings Free Tools & Trials
Legal Documents Terms of Use Privacy California Privacy Rights Security Information
©2021 SolarWinds Worldwide, LLC. All Rights Reserved.