Intro
Recently stumbled upon a modern dashboard widget type called drilldown. I had seen this before but didn’t give it much thought to how it would be used. That is, until I wanted to try and recreate the All Nodes widget from the Home Summary page in a modern widget. I thought about using a table widget but scrolling and the “row/column” feel didn’t feel as clean as a dropdown. As I began playing with the widget, I was unable to find any documentation related to this drilldown widget, which has led to writing up this document.
So, what is a modern drilldown widget?
A modern drilldown widget is like a classic “tree view” widget. The drilldown widget is a vertical navigation through groupings, ending at an object. We are filtering down groups to find objects of a particular kind.
Let’s look at parts of a modern dashboard drill down widget.

Looking at the basics of a drilldown widget, the first things to take note of beside the Title and Description are:
- First level grouping – This is what the query is grouped by first.
- Drilldown arrow – Clicking this will take us into the next grouping.
- Statuses – This is a count of all the objects where the EntityStatus is equal to either: Up, Critical, Warning, or Unknown.
The next level(s)
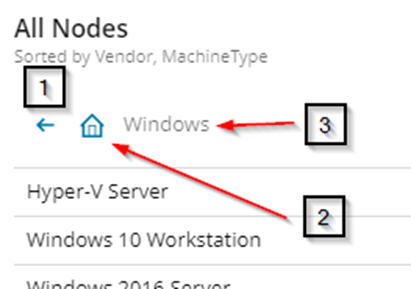
After we click on the Drill down, we will see the next level. Drilling down produces similar results to the top-level widget, but there’s some breadcrumbs to help us navigate.
- Back Arrow – This takes us back one level, drilling up.
- Home Button – This takes us back to the top-level group.
- Breadcrumbs – These let us know where we are at while drilling down through the groups. It will stack so we can keep navigating and know which levels we’re passing through.
The final level
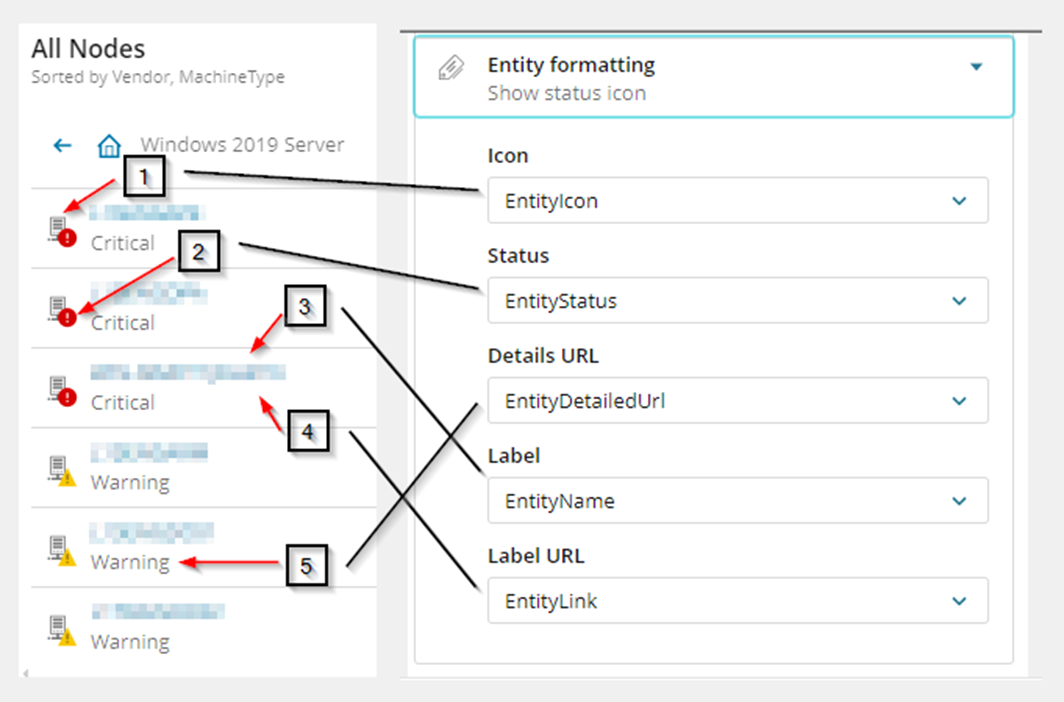
Once we get through all our group levels, we hit the list of objects in the last group. Once we get to the final level, there’s some differences to notice. Firstly, there is no longer the grouped status counts. Next, we will see new icons in the widget, let’s run through them:
- Entity Icon – This is the icon of the object.
- Entity Status – This is the status of the object.
- Entity Label – How should the object be named.
- Entity Label URL – This is the embedded hyperlink to the object. It’ll turn the label blue, signifying its clickable.
- Entity Details URL – This is a text field. Supposedly, it should be used to display the entities URL.
Making the widget
- Go to the Modern Dashboard and click the pencil in the upper right corner.
- Drag the widget to the board, and click Finish Configuring
- On the right hand pop out, change the widget type to drilldown, source dashboard to empty, click the radio button next to Drilldown Widget, then click customize on the bottom.
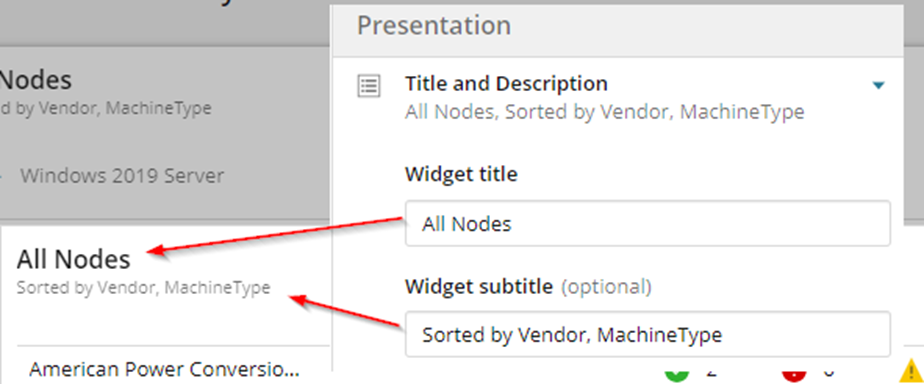
- Give the widget a Title and Subtitle, This will provide context and let others look it up in the future.
The SWQL Query
The drilldown query has required alias’s to make it work properly. They are:
- EntityIcon
- EntityStatus
- EntityDetailedUrl
- EntityName
- EntityLink
***These alias’s are case sensitive***
Let’s breakdown each of these.
EntityIcon
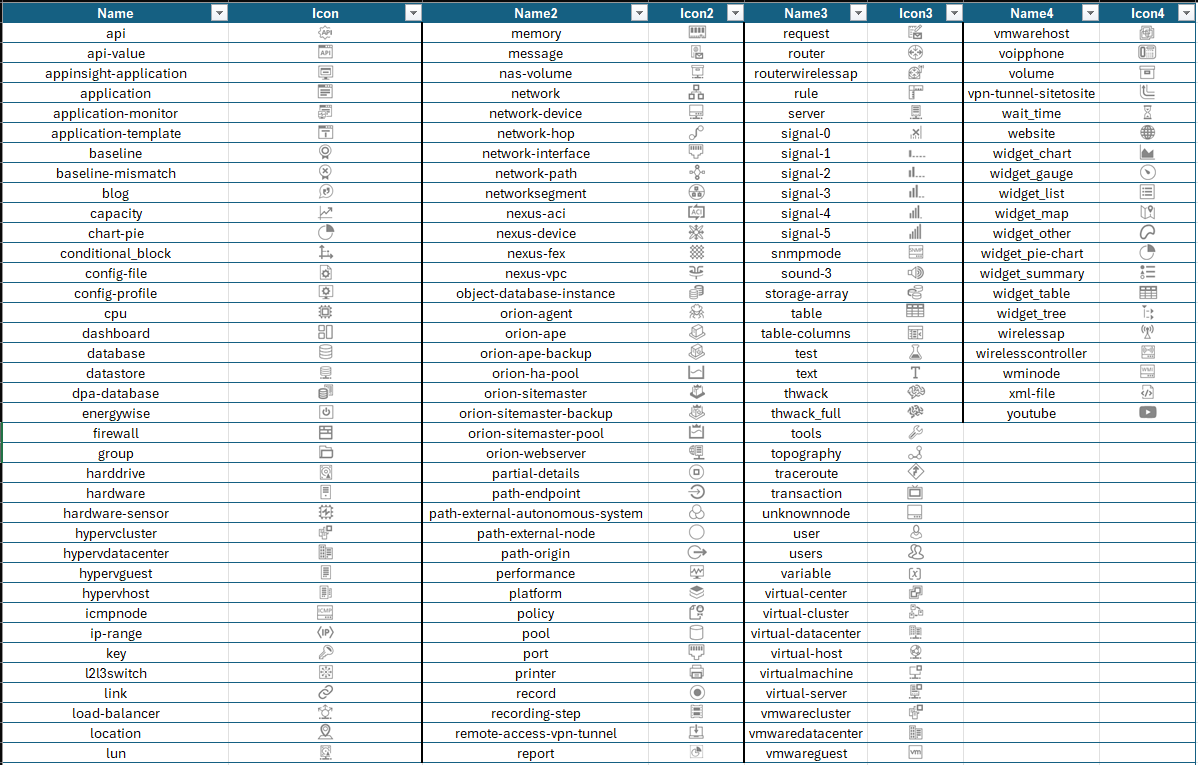
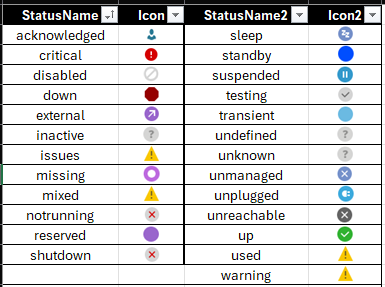
This is the icon that will be used to represent the object at the end. There is a specific list of icons that are eligible. If you look at an orion map, the OOTB icons that can be used there are available to the widget. Each icon has a specific ‘key’ that is only displayed when you hover over the icon in Orion maps. Here is a list of the keys and their respective icons.
EntityStatus
This is like the EntityIcon. There is a specific list of icons that could technically be applied to the final object. The problem with this is that the group status counts will only apply for up, critical, warning, and unknown. For the sake of simplicity, it’s best to lump like status together under one of those four categories. If you’re curious about the possible status’s and their icons, here is a list that was also made based off the orion maps.
EntityDetailedUrl
As mentioned earlier, I find this best used as a text holder. Since the specific status icons cannot be both in a group status and also on the object, I find this to be the perfect spot to put in it’s real status. Matching the short description from the status table to the node is clean and simple.
EntityName
This is the name of the object to be displayed. Caption works well here, but SysName is also a good fit.
EntityLink
This is the URL link to the object, typically URL is in the table somewhere and would take us to the respective page. In this case we use the details URL.
Grouping
Whatever extra columns you decide to call in can be used for grouping. Here we’re going to use Vendor and MachineType like in the all nodes widget.
Tidying Up
I find the ordering is off by default, so tossed in some ordering statements. This makes it much easier to scroll through and see whats high priority.
Final Thoughts
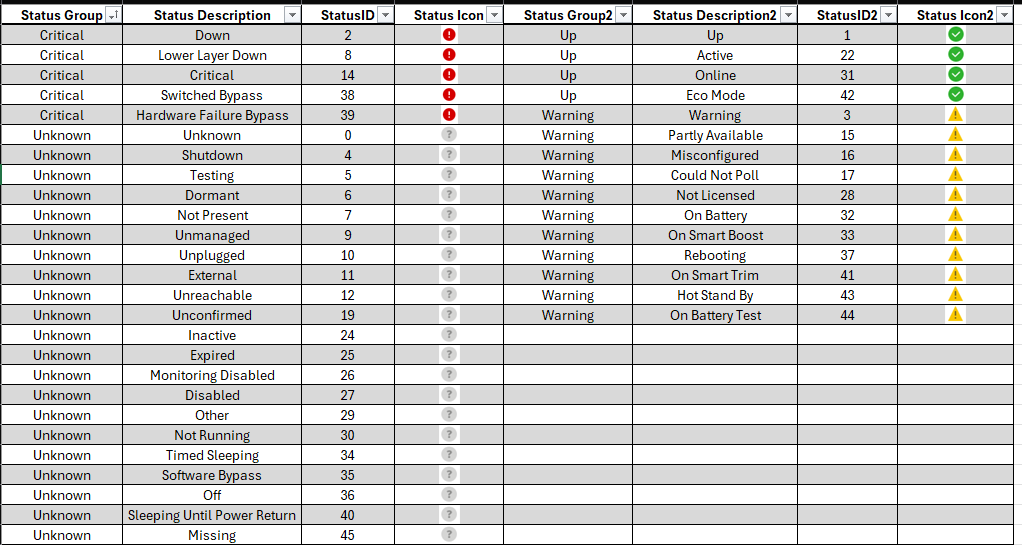
This was a fun widget to reverse engineer. If I had any suggestions to the SolarWinds Dev team it would be to put all the icons and status icons in a folder for easy reference. I would also like to see the ability to display more object group status’s at the top level instead of being limited to just 4. If your curious about the query and which status’s are grouped under which category, here is a list.
DEMO
