THWACK logo
THWACK
  • Sign In
  • Search
  • Community
    Community

    Find all you need to begin your THWACK journey, including documentation, missions, blogs, community groups, events, and media.

    Command Central
    • Getting Started
    MVP Program
    • MVP Program
    Monthly Mission
    • Puzzle Party
    Blogs
    • Community Announcements
    • Product Blog
    Groups
    • DevOps Discourse
    • Data Driven
    • See All Groups
    Events
    • SolarWinds User Group
    • THWACKcamp
      • ↪ 2024: On Demand
    • Bracket Battle
    Media Vault
    • Movies & Mainframes
    • TechPod
    • THWACK Tech Tips
    • THWACK Livecast
    • SolarWinds Lab Archive
    • THWACKcamp Archive
    • See All Media
  • Products
    Products

    Find the best place to learn and ask questions about your SolarWinds products.

    Observability
    • Observability Solutions
    • SolarWinds Observability SaaS
    • SolarWinds Observability Self-Hosted
    • SolarWinds Platform
    Network Management
    • Network Performance Monitoring
    • NetFlow Traffic Analyzer
    • Network Configuration Manager
    • IP Address Manager
    • User Device Tracker
    • VoIP & Network Quality Manager
    • Log Analyzer
    • Engineer's Toolset
    • Network Topology Mapper
    • Kiwi CatTools
    • Kiwi Syslog Server
    • ipMonitor
    Application Management
    • AppOptics
    • Loggly
    • Papertrail
    • Pingdom
    • DevOps
    IT Security
    • Access Rights Manager
    • Identity Monitor
    • Security Event Manager
    • Patch Manager
    • Serv-U FTP & MFT
    IT Service Management
    • SolarWinds Service Desk
    • Web Help Desk
    • DameWare Remote Support
    • DameWare Remote Everywhere
    • DameWare Mini Remote Control
    System Management
    • Server & Application Monitor
    • Virtualization Manager
    • Storage Resource Monitor
    • Server Configuration Monitor
    • SolarWinds Backup
    • Web Performance Monitor
    Database Management
    • Database Performance Analyzer
    • SQL Sentry
    • Database Performance Monitor
    • Database Mapper
    • Task Factory
  • Content Exchange
    Content Exchange

    Find downloadable files and templates other users have built and found useful to share with others.

    SolarWinds Platform
    • Alerts
    • Custom HTML
    • Custom Queries
    • Modern Dashboards
    • Reports
    • Scripts
    Server & Application Monitor
    • API Pollers
    • Application Monitor Templates
    Database Performance Analyzer
    • Custom Alerts
    • Custom Metrics
    • Custom Queries
    Server Configuration Monitor
    • Policies
    • Profiles
    Network Performance Monitor
    • Device Pollers
    • Universal Device Pollers
    Network Configuration Manager
    • Config Change Scripts
    • Device Templates
    • Firmware Upgrade Templates
    • Policy Documents
    SQL Sentry
    • Advisory Conditions
    Web Help Desk
    • Style Sheets
  • Resources
    SolarWinds Customer Portal Customer Portal

    Create individual user accounts for your team, manage your licenses, download your SolarWinds software, create and track support tickets, and more.

    SolarWinds Academy Academy

    A one-stop-shop for world-class training for SolarWinds products through on-demand videos, and instructor-led classes. All SolarWinds Academy content is included with every software purchase.

    SolarWinds Customer Success Support

    Get help when you need it from a world-class support team, available to assist with technical product issues 24 hours a day, seven days a week, 365 days a year.

    SolarWinds Partner Portal Partner Portal

    Accelerate SolarWinds Partners’ ability to drive digital and IT transformation for customers with powerful tools, resources, and increased profit potential.

  • Free Tools & Trials
  • Store
The SolarWinds Platform
  • Content Exchange
The SolarWinds Platform
Custom Queries Volume Utilization with Forecast Capacity
  • Tags
  • More
  • Cancel
Options
  • View all
  • Previous
  • Next
  • View slideshow
  • More
  • Cancel
fileName
Sign in to Download

Volume Utilization with Forecast Capacity

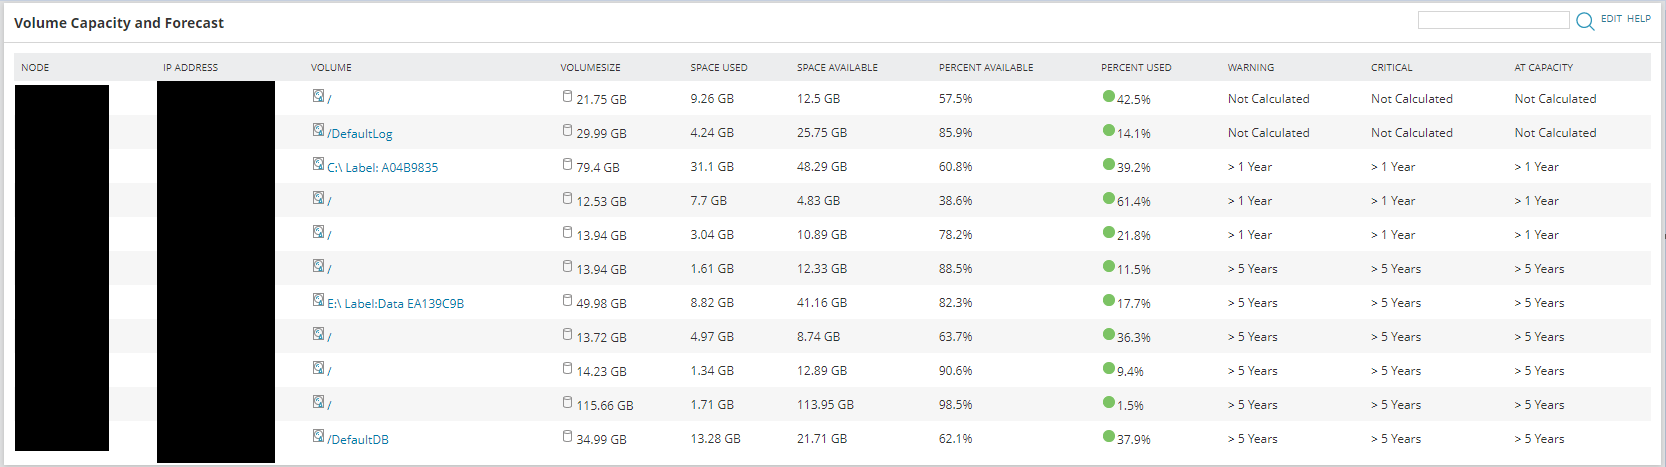
So I developed this a while ago, and recently have been asked for something similar again. Prompted me to refine it a little bit more and provide it to the larger community. Can be displayed as a custom query, and will display Volume information along with its capacity forecast. Decided to make this because its hard to get those metrics in one consolidated widget. The code to make it searchable by Volume/Node caption is already present, just uncomment where appropriate.

  • With Search
  • sam
  • volume
  • SWQL
  • npm
  • utilization
  • capacity forecast
  • Network Performance Monitor (NPM)
christopher.t.jones123
  • 26 May 2022
  • 285 Downloads
  • Share
  • More
  • Cancel
  • Sign in to reply
  • Rave101208
    Rave101208 2 months ago in reply to einnor

    Do we have a solution for this.

    • Cancel
    • Vote Up 0 Vote Down
    • Sign in to reply
    • More
    • Cancel
  • einnor
    einnor over 1 year ago in reply to crawoo

    I also encountered this problem......

    • Cancel
    • Vote Up 0 Vote Down
    • Sign in to reply
    • More
    • Cancel
  • crawoo
    crawoo over 1 year ago

    Hi, just found this and like the look of it. I have run it SWQL Studio and it does output all the data but I notice about a third of the nodes for Warning, Critical and At Capacity columns have the value 'Not Calculated '. Looking at the nodes I see they have well over 12 months of historic data.
    I had half an idea what the problem was so consulted chat gpt Slight smile

    The output 'Not Calculated' is generated when certain fields in the orion.forecastcapacity table are NULL. Specifically, in the CASE statements for calculating warnings, critical alerts, and days until capacity, the conditions check for NULL values. If the values for DaysToWarningAvg, DaysToCriticalAvg, or DaysToCapacityAvg are NULL, the corresponding CASE statement will output 'Not Calculated'.

    For example, in the following portion of the code:

    sqlCopy code
    CASE WHEN F.DaysToWarningAvg IS NULL THEN tostring('Not Calculated') ... END AS [Warning]

    If the DaysToWarningAvg column in the orion.forecastcapacity table contains NULL values for certain records, the CASE statement will result in 'Not Calculated' being output for those records. This indicates that the warning days could not be calculated due to missing data or other reasons.

    Anyone else get this or know how I can get the data populated?

    • Cancel
    • Vote Up 0 Vote Down
    • Sign in to reply
    • More
    • Cancel
  • mhashim
    mhashim over 1 year ago

    i tried to change from Volume to CPU load and memory result was empty, can you show me how to get capacity forecast for CPU and Memory, thanks 

    • Cancel
    • Vote Up 0 Vote Down
    • Sign in to reply
    • More
    • Cancel
  • IanBaker
    IanBaker over 1 year ago

    This is Great gives me a super view of the capacity for volumes... Now to have a look at Processor and Memory Capacities... Thanks again

    • Cancel
    • Vote Up 0 Vote Down
    • Sign in to reply
    • More
    • Cancel

SolarWinds solutions are rooted in our deep connection to our user base in the THWACK® online community. More than 200,000 members are here to solve problems, share technology and best practices, and directly contribute to our product development process.

SolarWinds Customer Success Center Certification SolarWinds Lab Link Customer Portal
About THWACK SolarWinds Blog Federal & Government Edit Settings Free Tools & Trials
Legal Documents Terms of Use Privacy California Privacy Rights Security Information
©2021 SolarWinds Worldwide, LLC. All Rights Reserved.