Introduction
Currently, when DPA monitors databases within an Azure Elastic Pool, each database is registered and monitored individually, with metrics collected separately for each one. However, some users have expressed interest in also viewing broader, Elastic Pool-level metrics within DPA. This higher-level data can be collected using custom metrics based on the sys.dm_db_resource_stats DMV.
DMV Information
This DMV includes two columns that provide Elastic Pool-level data for Azure SQL Databases. The data is retained for one hour, with a new row written every 15 seconds. Since DPA can execute metric queries at most once per minute, it's recommended to use average values when interpreting the data. Custom metrics should be created as needed for each relevant metric (see example below). For detailed information, refer to the official documentation: sys.dm_db_resource_stats.
DPA Configuration
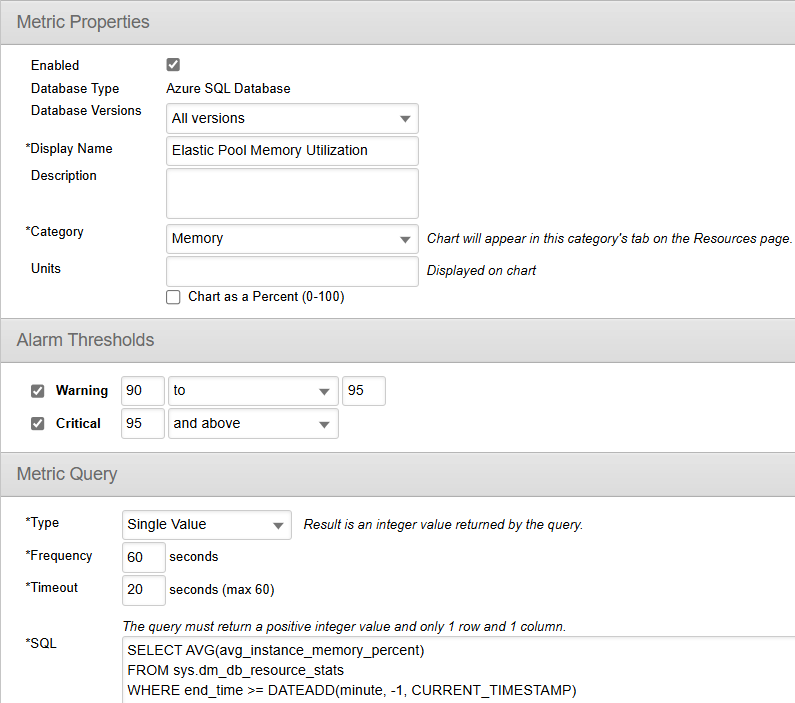
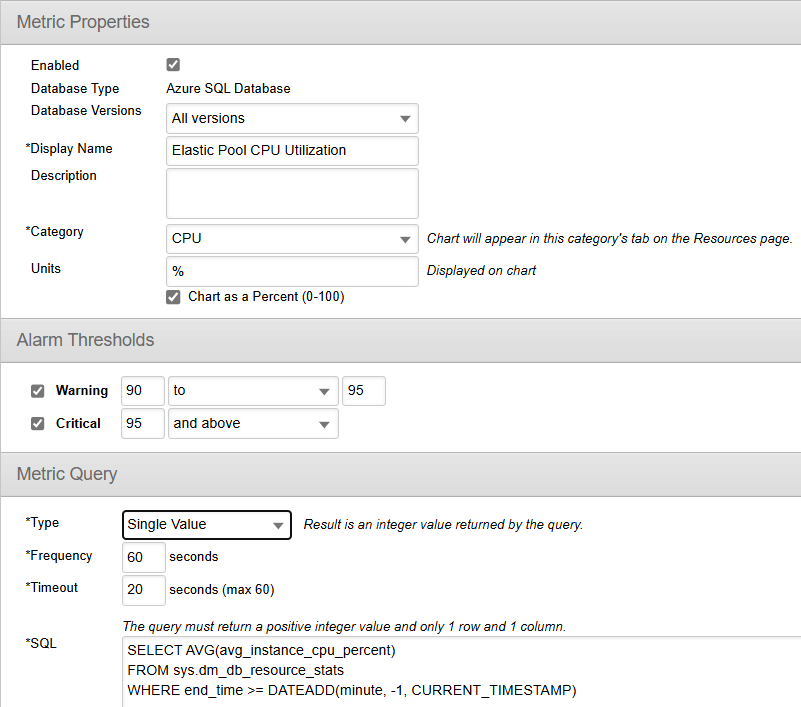
Create two custom metrics of the type Single Value, using the two provided queries—one for each metric. Below are examples of how these custom metrics can be configured:
CPU
Memory