DPA currently collects O/S CPU Utilization from the dm_os_ring_buffer DMV with a query like this:
SELECT top 1 100 - systemidle
FROM (SELECT record.value('(./Record/@id)[1]', 'int') AS record_id,
record.value('(./Record/SchedulerMonitorEvent/SystemHealth/SystemIdle)[1]','int') AS systemidle,
record.value('(./Record/SchedulerMonitorEvent/SystemHealth/ProcessUtilization)[1]', 'int') AS sqlprocessutilization, timestamp
FROM (SELECT timestamp,
CONVERT(XML, record) AS record
FROM sys.dm_os_ring_buffers
WHERE ring_buffer_type = N'RING_BUFFER_SCHEDULER_MONITOR'
AND record LIKE '%%') AS x) AS y
ORDER BY record_id DESC
However, this query can be incorrect when SQL Server is running on Linux. Here is how to get DPA to collect the real CPU utilization numbers from the O/S itself using the OPENROWSET command.
Step 1 - Linux stores CPU utilization numbers in /proc/loadavg in the Linux O/S. However, SQL Server cannot read that file directly, so we need to create a symbolic link as follows:
<span><span class="ui-provider cip ciq c d e f g h i j k l m n o p q r s t cir cis w x y z ab ac ae af ag ah ai aj ak" dir="ltr">ln -s /proc/loadavg /var/opt/mssql/loadavg</span></span>
Step 2 - Create a custom metric (Options > Custom Metrics) within DPA to read that file and parse out the CPU utilization.
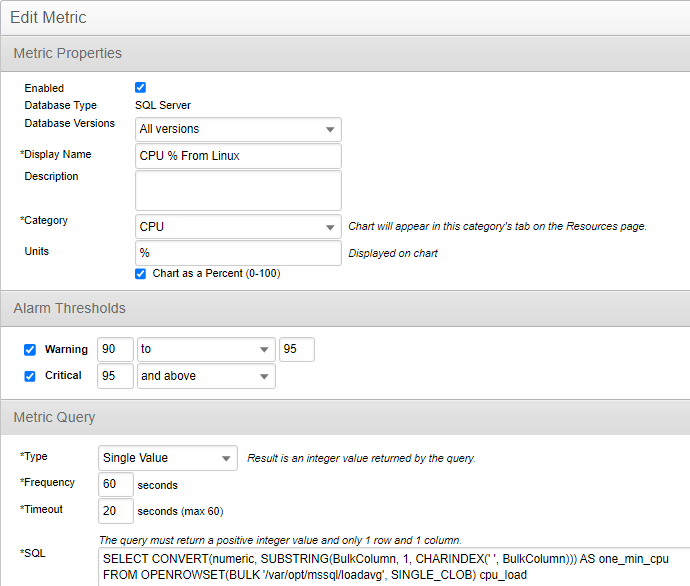
SQL Statement:
<span>SELECT CONVERT(numeric, SUBSTRING(BulkColumn, 1, CHARINDEX(' ', BulkColumn))) AS one_min_cpu<br />FROM OPENROWSET(BULK '/var/opt/mssql/loadavg', SINGLE_CLOB) cpu_load</span>