To see a deadlock report for a single instance in DPA, drill into the instance and select the Deadlock tab on the Trends tab. This will show both a chart as well as deadlock details. However, if you want a global deadlock report across all monitored instances, the attached query will provide it.
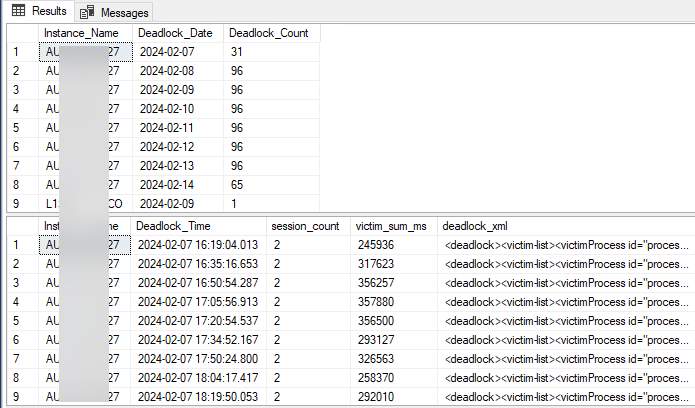
There are two results that will be output from this script:
- A summary table that lists each instance, the date and number of deadlocks that occurred
- A detail table that lists each deadlock
Running the Script
To run this script, use your favorite SQL development tool, and connect to the DPA repository database. If you login as the DPA owner username, remove the "ignite" schema in front of each table. The default time range for the report is 7 days, but that can be modified by changing the @StartDate and @EndDate variables in the top 2 lines of the report.
Producing a Deadlock Graph
The contents of the column named Deadlock_XML can be copied to a text editor or a new query window in SSMS. From there, you can save it to a file with a .XDL extension and open with SSMS to see the deadlock graph.
Here is a sample of the output:
