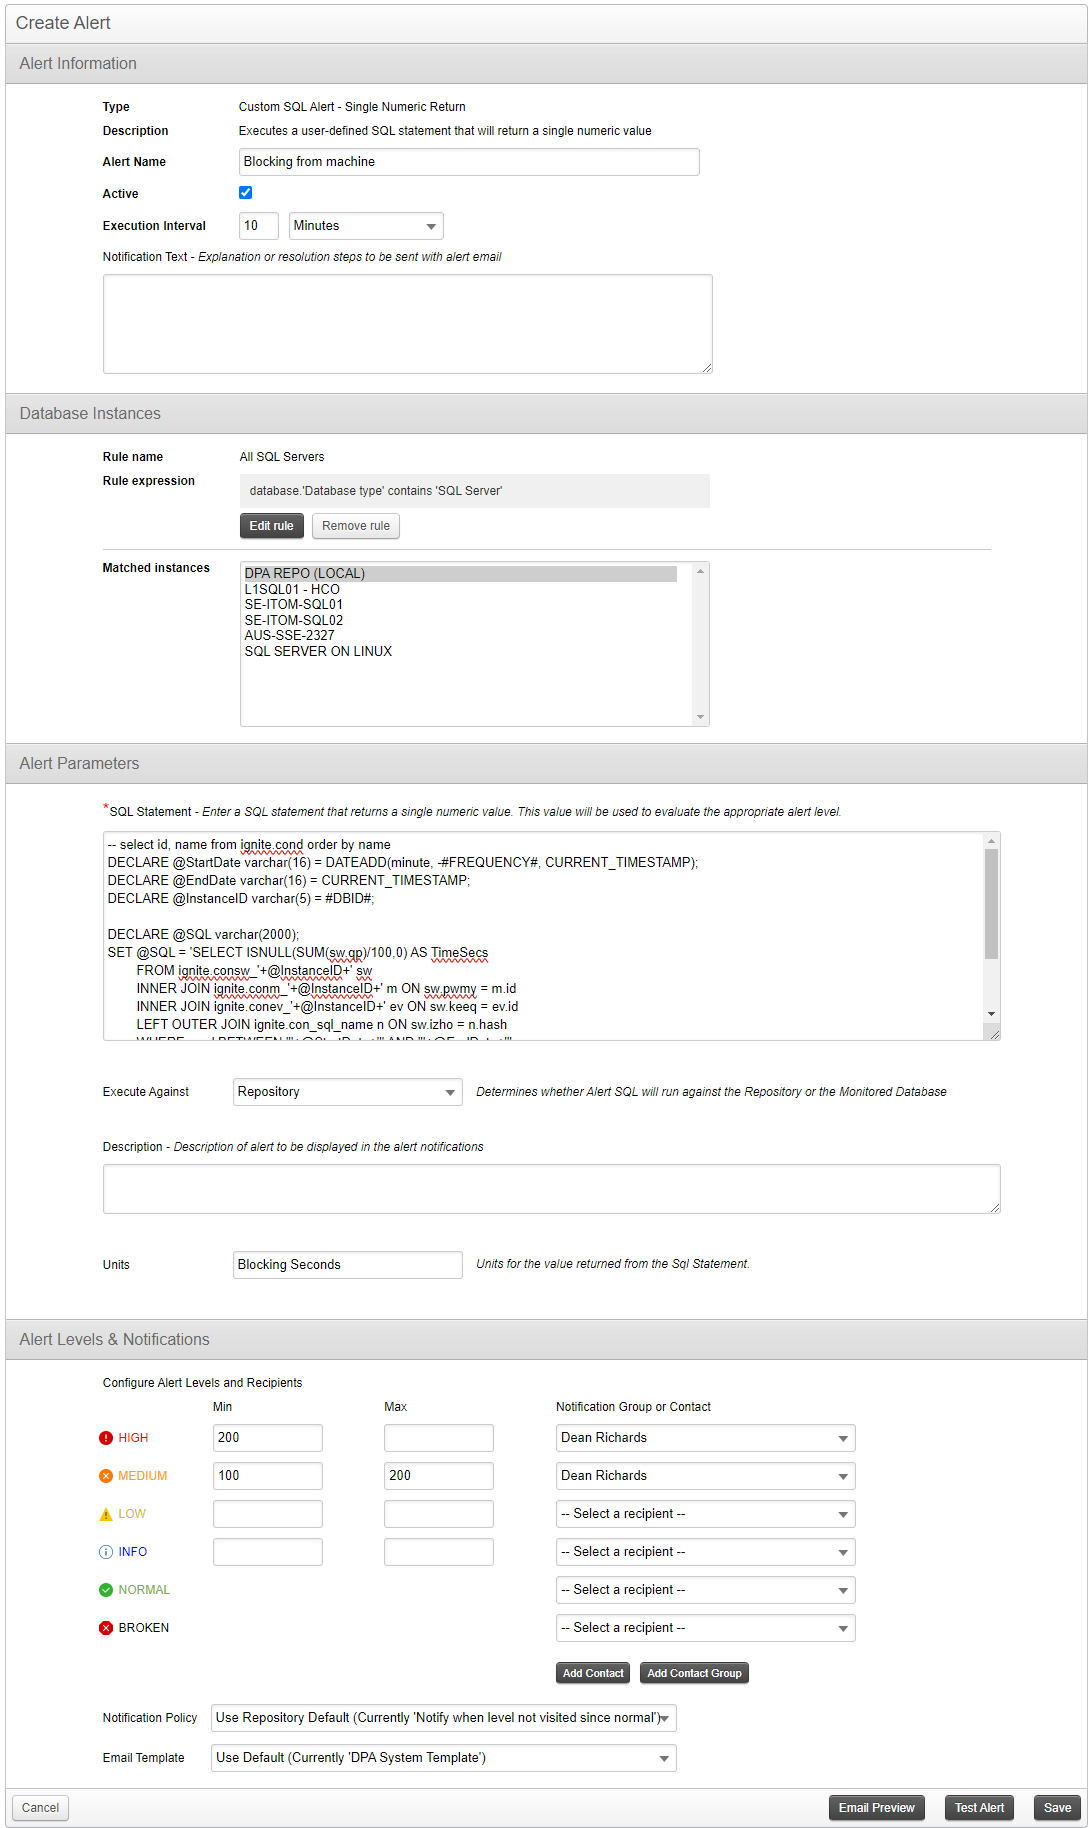
Shared Files for Database Performance Analyzer
  • MySQL CPU and Memory Utilization

    Description CPU and Memory utilization are not base metrics in DPA's Resource tab for MySQL because the data is not available from within the database. However, by loading data periodically from the O/S into a table, we can make CPU and Memory information available so DPA can query it. If your MySQL database is running on Linux, there is a file name /proc/loadavg that provides CPU information, and /proc/meminfo that provides Memory information. Note: if you are using Windows, Performance Monitor...
  • Oracle Monitoring - Collecting Service Name (and others)

    Disclaimer Note: the topic of this post is for advanced Oracle users only. If done incorrectly, you can break the DPA monitoring for the instance and you will not be supported. However, at the bottom of the attached script are two commands to help you recover back to default installation. Also , once these changes have been done, this change will not officially be supported by SolarWinds technical support. For questions and help with this, please leave comments and someone will get back to...
  • CPU Utilization for Azure SQL Database using vCore Purchasing Model

    DPA currently collects and displays DTU metrics for Azure SQL Databases. However, if you're using the vCore purchasing model, those metrics are not present and will show as blank in DPA. To get the CPU Utilization metrics for your vCore system, here are some screenshots and queries that you can use as Custom Metrics in DPA. The DMV provides not only database level CPU utilization, but also exposes instance level CPU utilization as well for the times when you have multiple databases on a single server...
  • SQL Server - O/S CPU Utilization on Linux Server

    DPA currently collects O/S CPU Utilization from the dm_os_ring_buffer DMV with a query like this: SELECT top 1 100 - systemidle FROM (SELECT record.value('(./Record/@id)[1]', 'int') AS record_id, record.value('(./Record/SchedulerMonitorEvent/SystemHealth/SystemIdle)[1]','int') AS systemidle, record.value('(./Record/SchedulerMonitorEvent/SystemHealth/ProcessUtilization)[1]', 'int') AS sqlprocessutilization, timestamp FROM (SELECT timestamp, CONVERT(XML, record) AS record FROM sys.dm_os_ring_buffers...
  • Collect Azure SQL Elastic Pool Metrics

    Introduction Note: The attached code was used to accomplish the steps in the Database Configuration section below, which is a prerequisite to the DPA alert configuration. Currently, when DPA monitors databases within an Azure Elastic Pool, each of the databases are registered independently. This means that DPA collects metrics for each of the databases individually. However, some users have also expressed the desire to view higher level Elastic Pool metrics within DPA as well. We have found a...
  • SQL Server Replication Metrics (11 metrics)

    For monitoring SQL Server replication, here are 11 metrics I often add into DPA as custom metrics. Some of these are optional and would only apply if you are using, for example, merge replication. Add each one as a separate custom metric (Options > Custom Metrics) in DPA and make them look similar to this example. Note that not all of them will have thresholds as this one does. I like to add thresholds on the latency metrics and the merge conflicts metric, so that I can also alert on them:
  • DB2 Database Size (MB)

    Within Db2 databases, the system table SYSIBMADM.TBSP_UTILIZATION stores information about tablespaces, and specifically their sizes. All rows can be added together to arrive at the size for the entire database. Once this metric is in place, here is a custom alert that can be used to notify you of excessive growth: https://thwack.solarwinds.com/content-exchange/database-performance-analyzer/m/custom-alerts/3453 To create the Custom Metric in DPA, click on Options > Custom Metrics and clik the...
  • Postgres CPU and Memory Utilization

    Description CPU utilization is not a base metric in DPA's Resource tab because the value is not available from within the database. However, by using Foreign Data Wrappers (FDW) we can make host information available to the database so that DPA can query it. If your Postgres database is running on Linux, there is a file name /proc/loadavg that provides CPU information, and /proc/meminfo that provides Memory information. Note: if you are using Windows, Performance Monitor (perfmon) can be used...
  • TempDB Contention

    Description Contributed by Spaceman Checks for tempdb contention. Had an issue recently caused by this, other metrics didn't highlight much of a problem other than high pagelatch waits. Resolved by adding more data files to tempdb in my case (other options are available though! see The Accidental DBA (Day 27 of 30): Troubleshooting: Tempdb Contention - Paul S. Randal ) Metric Definition To create the metric, click on Options > Custom Metrics and configure similar to the attached screenshot...
  • SQL Server Oldest Open Transaction

    This metric tracks the session with the oldest open transaction and returns the date difference in seconds. If you want to alert off this metric, ensure the thresholds are configured. Query Text SELECT ISNULL(MAX(DATEDIFF(second, start_time, CURRENT_TIMESTAMP)), 0) FROM sys.dm_exec_requests WHERE open_transaction_count > 0
  • Synthetic Transaction to Measure Application Performance

    This custom metric tracks the time it takes for a query to execute against one of your monitored instances. The query can be something one of your applications runs often, a query that is important to your business, etc. In the example, I use a simple query against sys.dm_exec_requests DMV. If you want to alert off this metric, ensure thresholds are also configured and create a Resource Alert against it.
  • Custom Metric - Oracle Standby Database Log Apply Drift Metric

    This custom metric will collect data every 10 minutes and plot the delta between redo logs archived on the primary instance and logs applied on the standby instance. METRIC DEFINITION To create the custom metric, click on Options > Custom Resource Metrics and configure the metric similar to this: Database Type: Oracle Database Versions: <no limitations> Display Name: Log Apply Drift Description: <add your own description> Category: <add to whatevfer category you like or create a...
  • SQL Server Page Splits per Second

    A page split typically occurs when an INSERT or UPDATE statement is adding data to a page but there is no space left to do so. In this case, SQL Server creates a new page and moves some of the data to it, thus a splitting of the page. This is a fairly normal process to occur when data is being added to the database. However, too many page splits can cause fragmentation and can hurt performance. This custom metric allows DPA to collect the data so it can be correlated to other metrics and performance...