Basically four interface aggregate charts,
- interfaces' availability
- interfaces' average receive/transmit percent utilization
- interfaces' 95th percentile
- interfaces' 99th percentile
need to be in a page, for interface groups based on location. Kind of similar to the server aggregate charts below.
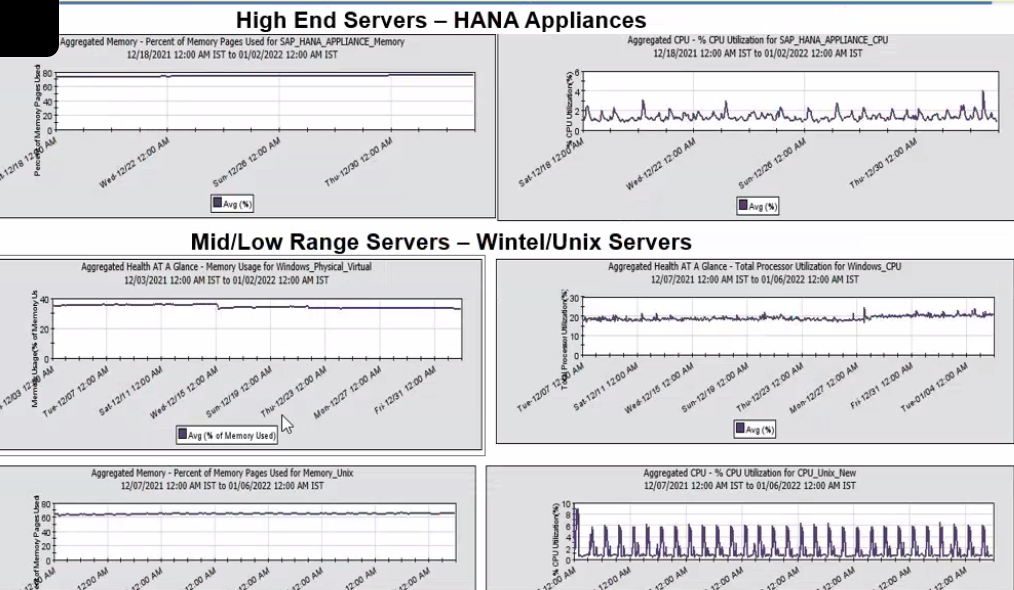
Now these interface groups are dynamically created based on custom property Location and there are at least 40 to 50 such locations, hence 40 to 50 interface groups.
Unlike the interface details page and node details page, where the page contents dynamically reflect the current object's values, I understand it is not possible to have a customized Group Details page since the group might contain heterogeneous objects and it is not possible to have a "current object" for a group.
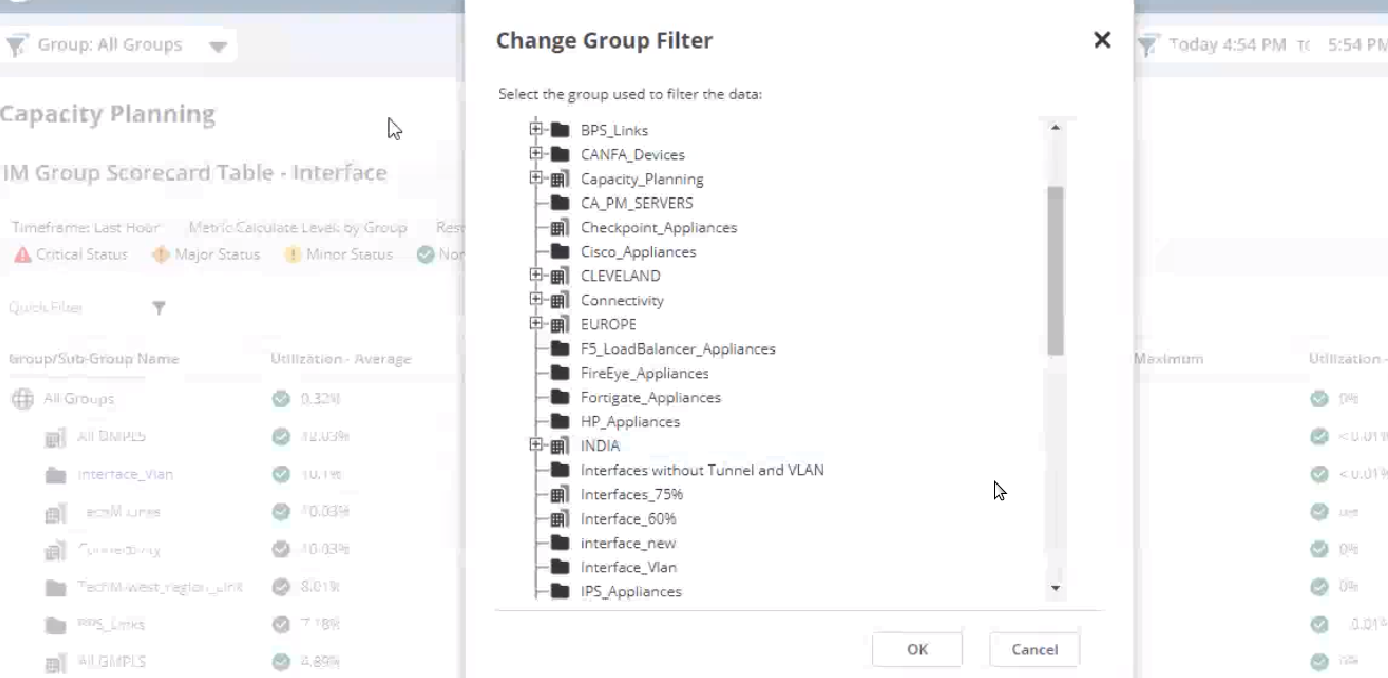
Is there any way to achieve a page filter which allows selection of Group name and possibly a date-time filter that allows selection of timeframe (as it is available in NTA summary page)?
If there isn't a way to dynamically select and populate the contents of the page, I believe the only option would be create multiple separate reports for each location?
It would be interesting to hear thoughts on this.
Thanks!

