We’re excited to announce a release candidate (RC) for version 2026.2 of the SolarWinds® Platform, SolarWinds® Observability Self-Hosted, and the Orion Network and Systems modules. Version 2026.2 RC is now available for all customers under maintenance, so log in to your customer portal to download it. Want to see everything new? Check out the Release Notes.
Here is a quick list of all the major features with links to a post with more detailed information. The bolded features are described in detail in the following sections.
Observability Self-Hosted exclusives:
- Preview: SW1, the SolarWinds AI Agent
- One button enablement
- Chat history
- Support for virtual entities and application templates
- Routing Insights:
- Routing Summary Dashboard
- Expanded Cloud Monitoring:
- Cloud Cost Summary
- GCP: Kubernetes (GKE)
- Azure: Table Storage, Virtual WAN
- AWS: Elastic Beanstalk, Transit Gateway
- APE workload load balancing
- Risk Analysis adds device support for Huawei, Red Hat Linux, Dell DRAC/iDRAC, Axis, Microsoft Hyper-V, Extreme Networks HiveAP 20.
- Proxmox VM management actions (power on/off, snapshot, motion VM/storage, change resource settings)
Observability Self-Hosted, Network, and Infrastructure Modules
- Add L2/L3 support for Extreme switches
- SD-WAN: Support for FortiManager (on premises)
- Hardware Health for Cisco Modules
- Storage: Dell PowerMax storage arrays (2500 and 8500 models)
- IPAM: Azure Virtual Nets
- Containers: Docker 26+ support
- Agent: RHEL 10 support
- Logs: Compound searches (AND/OR)
SolarWinds Platform (available to all products)
- New Discovery Central
- What’s New Page
- Alert Suppression
- Simplified Network Discovery (Four step wizard, smart defaults)
- New options for weekly and monthly maintenance schedules
- Intelligent Maps fixes and improvements
- TLS 1.3 support for agents
- gMSA support for the databases (Orion/Logs/Flows)
- And more…
Preview: SW1, the SolarWinds AI Agent
In OSH 2026.2, SW1 becomes easier to adopt and more powerful in day-to-day use. These enhancements help customers get value faster, reduce setup friction, and unlock deeper insights directly from conversation. Whether you are just turning the AI Agent on for the first time or relying on it every day, it now fits more naturally into existing workflows and surfaces richer, more contextual answers.
- One-click AI Agent activation: The AI Agent is now visible in the top menu for all users. When admins click the icon, they can enable Platform Connect by entering their email and selecting “Agree and connect,” while non-admins see an option to notify an administrator.
- Support for virtual entities and application templates: The AI Agent now understands and works with additional entity types, including virtual entities and application templates, expanding where you can use AI assistance.
- Chat history: A new History tab lets you return to previous conversations and pick up where you left off, with full context preserved.

Routing Insights Summary Dashboard
This release version introduces a new Routing Summary dashboard that provides a single, network-wide view of routing health across all monitored devices. The dashboard aggregates key indicators such as control-plane stability, protocol-level churn, most unstable prefixes and nodes, and VRF or tenant impact into a guided, top-to-bottom flow. By turning enriched routing data into an at-a-glance summary, the feature helps teams identify routing issues faster and reduce the time required to isolate failing prefixes, devices, and neighbor sessions.
Read more in the Routing Insight blog post.

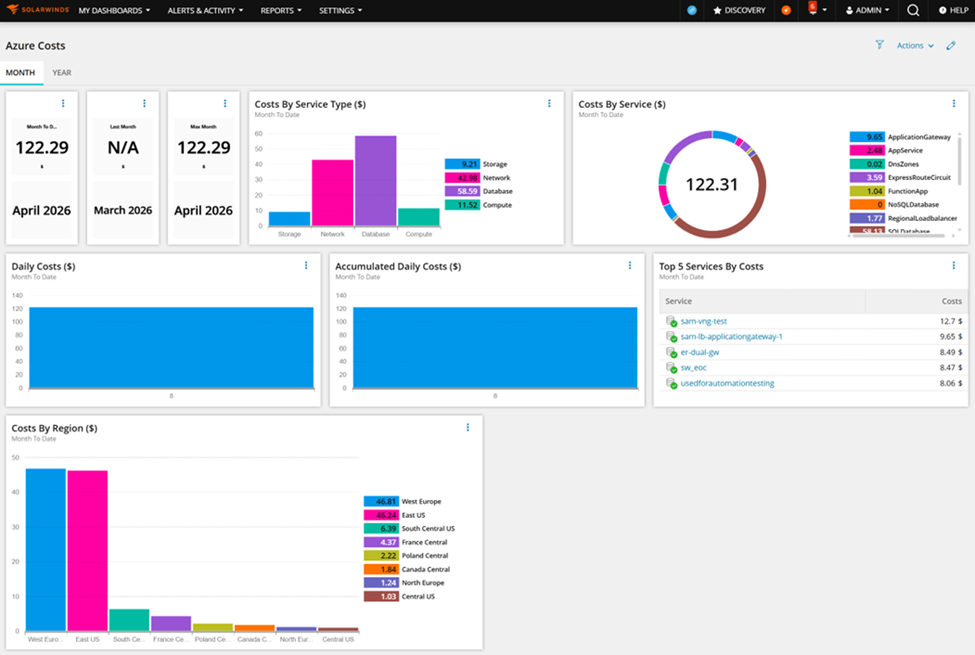
Cloud Cost Summary
OSH 2026.2 introduces a new Cloud Cost Dashboard designed to bring cost visibility directly into your observability workflow. The dashboard combines high-level KPIs with detailed analysis, enabling users to quickly understand spending trends and anomalies. Users can seamlessly filter data by account, category, service, and region, making it easy to isolate cost drivers across complex cloud environments.
Dedicated detail pages for AWS, Azure, and GCP provide deeper cost analytics with flexible filtering (for AWS and Azure in this release) and granular breakdowns for both current month and year views. The intuitive Month and Year tabs allow users to switch perspectives and track spending over different time horizons. Key performance indicators include cost by service and service type, top five services by spend, and daily as well as accumulated costs.
Additional insights such as Month-to-Date, Year-to-Date, Last Month/Year, and Max Month/Year metrics help teams benchmark and optimize cloud usage. Integrating cost data directly into the monitoring experience enables faster, more informed decisions. This unified approach empowers teams to proactively manage cloud expenses while maintaining full operational visibility.
Engine Load Balancing
Engine load balancing in this release automatically monitors engine health and reassigns eligible ICMP- and SNMP-polled nodes between Additional Polling Engines in the same High Availability pool. When rebalancing starts, nodes from overloaded engines are redistributed across all other healthy engines, which helps maintain higher polling completion and more predictable performance. This reduces the day-to-day admin overhead of manually shuffling nodes between engines and lowers the risk of misconfiguration. Engine load balancing is off by default and must be manually enabled for each High Availability pool you want it to manage.
Meet the New Discovery Central
Discovery should be one of the fastest ways to start getting value from your monitoring platform. That idea is behind the new Discovery Central—a refreshed, single-page experience designed to bring discovery and configuration paths together in one place. Discovery Central is meant to provide a quick overview of what is already being monitored while also making it easier to see how to discover and onboard more of the environment for monitoring.
Discovery Central still does everything the legacy page did but now offers pointers to additional recommended actions as well as direct links to instant evaluation activations for features you haven’t previously explored in the product. You can find the new Discovery Central by following the same path as in previous versions, or there is a new “Discovery” button embedded in the main menu at the top of the UI. (or at the top of every page in the menu bar?)
You’ll also note a tab labeled “What’s New” that will show you a detailed summary of the newest features and updates.

Alert Suppression
This release extends the core Alerting Engine with a new Suppress Condition, evaluated alongside existing Trigger and Reset logic to keep alert streams focused on real root causes. Alerts on child entities—such as interfaces, volumes, and routing neighbors—can now be automatically suppressed when their parent node is down, preventing the usual flood of secondary symptoms during device or site outages. Suppressed alerts are still created and stored with SUPPRESSED Status, ensuring full auditability in Active Alerts, out-of-the-box reports, and through the SWIS SDK, but actions and escalations are skipped. Because the suppress condition is evaluated every minute against live network state, suppression reacts immediately as nodes and dependencies change, and is available across all supported entity types in the alerting engine.
Read more in the Alert Suppression blog post.

Security Always
We focus on securely coding, building, and delivering software to you. SolarWinds Aims to Set New Standard in Software Development with Next-Generation Build System. Our choices in forging the SolarWinds Platform align with our Secure by Design philosophy, enhancing our ability to execute this vision now and in the future.
How to Download
The 2026.2 release candidate is a fully tested and supported version and is ready to install on a new server or update your current one.
- For all current Observability Self-Hosted customers, the release is available now. You can log in to your customer portal and download it.
- For all current module and bundle customers, the release is available now. You can log in to your customer portal and download it.
- If you don’t own Observability Self-Hosted but would like to try it or one of its new features, there are a couple of options for you:
- Download a 30-day free trial and install it on a new server.
- If you’re a current module or bundle customer, upgrade to 2026.2 first and use the instant evaluation feature to try Observability Self-Hosted for 30 days with a click of a button. You can switch back to your modules anytime.
To see everything included in the release, check out the Release Notes.
Not Quite Ready for the Release Candidate?
If you aren’t ready to upgrade to the Release Candidate, a 2026.1.1 Service Release is available – see the 2026.1.1 Release Notes for all the details.
What’s Next?
The 2026.2 release is another step forward, but there is always more to do. Check out our What We’re Working On post for what’s coming next for the SolarWinds Self-Hosted platform and products.
—The Observability Self-Hosted Team