Hot off the heels of my previous post of new Server & Application Monitor content for Microsoft SQL and Exchange, as well as SAP HANA, we also now have some new and enhanced content for monitoring your Oracle databases. As mentioned in my previous blog post, this will be a steady drumbeat of releasing new and enhanced monitoring content for SAM, so please keep an eye out on THWACK and I will keep you up to date via the product blog as well.
First off, as of today, these templates still require the additional components be installed and added to the Orion Server and/or poller that these databases are being monitored from. We have documentation about this already in the Success Center here:
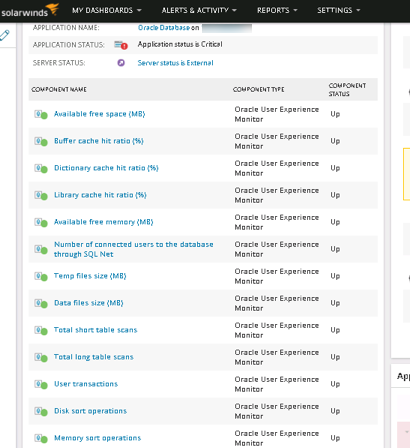
Oracle Database:
https://thwack.solarwinds.com/docs/DOC-203309
This template contains newly added performance and statistics counters for Oracle Database.
Prerequisites: Oracle client installed on Orion APM server. This is available from the SolarWinds customer portal under Additional Downloads.
Credentials: An Oracle username and password with read access to the Oracle tables.
MONITORED COMPONENTS
Components without predetermined threshold values provide guidance such as "Use the lowest threshold possible" or "Use the highest threshold possible" to help you find an appropriate threshold for your application. For more information, see http://knowledgebase.solarwinds.com/kb/questions/2415.
This component monitor returns the System Global Area (SGA) as the part of the system memory (RAM) shared by all the processes belonging to a single Oracle database instance.
Unit: Bytes
Source: https://docs.oracle.com/cd/B28359_01/server.111/b28320/dynviews_3028.htm#REFRN30233
Program Global Area (PGA) is a private memory region that contains the data and control information for a server process. Only a server process can access the PGA. Oracle Database reads and writes information in the PGA on behalf of the server process. Oracle Database automatically sizes the PGA by dynamically adjusting the portion of the PGA memory
dedicated to work areas, based on 20% of the SGA memory size. The minimum value is 10MB.
PGA memory currently allocated by the process (including free PGA memory not yet released to the operating system by the server process)
Unit: Bytes
Source: https://docs.oracle.com/cd/B28359_01/server.111/b28320/dynviews_2098.htm#REFRN30186
This component monitors the buffer pool size for the Oracle Database. The default buffer pool size is determined by the DB_CACHE_SIZE initialization parameter.
Unit: Bytes
Source: https://docs.oracle.com/en/database/oracle/oracle-database/12.2/refrn/V-BUFFER_POOL.html#GUID-1E70B05F-6E52-44B0-AFB3-5ADDA620008D
This component monitors the shared pool area size. The shared pool is a RAM area within the RAM heap that is created at startup time, a component of the System Global Area (SGA). The size depends on the size of your RAM.
Unit: Bytes
Source: https://docs.oracle.com/cd/B19306_01/server.102/b14237/dynviews_2106.htm#REFRN30238
- Buffer Pool Response Time
This component monitors the buffer pool response time. The value should be low for good performance.
The query below calculates response time for logical reads per second from buffer within an interval of 15 seconds.
Unit: Seconds
Source: https://docs.oracle.com/cd/E11882_01/server.112/e40402/dynviews_3090.htm#REFRN30343
- Single block read response time
This component monitors the cumulative single-block read response time at the file level in seconds. This value should be low. A high value means a high latency.
Unit: Seconds
Source: https://docs.oracle.com/en/database/oracle/oracle-database/12.2/refrn/V-FILESTAT.html#GUID-9DF61EA4-EF94-4F60-B966-D1B9AFEFF3E0
- Multi block read response time
This component monitors the cumulative multi-block read response time at file level in seconds. This value should be low. A high value means a high latency.
Unit: Seconds
Source: https://docs.oracle.com/en/database/oracle/oracle-database/12.2/refrn/V-FILESTAT.html#GUID-9DF61EA4-EF94-4F60-B966-D1B9AFEFF3E0
This component monitors log write response time. The response time here includes write time + wait time that log writer spent waiting.
Unit: Seconds
Source: https://docs.oracle.com/cd/E18283_01/server.112/e17110/statviews_4061.htm
https://docs.oracle.com/cd/B19306_01/server.102/b14237/statviews_3177.htm
This component monitors the physical I/O total rate. The total rate includes read rate + write rate per sec.
A high value means a better performance.
Unit: Bytes/second
Source: https://docs.oracle.com/cd/E11882_01/server.112/e40402/dynviews_3090.htm
This component monitors the physical I/O read rate per sec.
A high value means a better performance.
Unit: Bytes/second
Source: https://docs.oracle.com/cd/E11882_01/server.112/e40402/dynviews_3090.htm
This component monitors the physical I/O write rate per sec.
A high value means a better performance.
Unit: Bytes/second
Source: https://docs.oracle.com/cd/E11882_01/server.112/e40402/dynviews_3090.htm
This component monitors latency for commits by all users. If the value is null that means the number of commits per second is 0.
Unit: Seconds
Source: https://docs.oracle.com/cd/E11882_01/server.112/e40402/dynviews_3090.htm
This component monitors SQL*Net receive rate (clients + dblinks). In other words, bytes received via SQL*Net from client + bytes received via SQL*Net from dblink.
Unit: Bytes/second
Source: https://docs.oracle.com/cd/B28359_01/server.111/b28320/dynviews_3086.htm
This component monitors SQL*Net send rate (clients + dblinks). In other words, bytes sent via SQL*Net to client + bytes sent via SQL*Net to dblink.
Unit: Bytes/second
Source: https://docs.oracle.com/cd/B28359_01/server.111/b28320/dynviews_3086.htm
This component monitors the total number of active sessions at any moment.
Unit: Count
Source: - https://docs.oracle.com/cd/B19306_01/server.102/b14237/dynviews_2088.htm
This component monitors the number of active sessions waiting to be run.
Unit: Count
Source: https://docs.oracle.com/cd/B19306_01/server.102/b14237/dynviews_2088.htmCPU.
This component monitors the total number of active sessions currently executing on CPU.
Unit: Count
Source: https://docs.oracle.com/cd/B19306_01/server.102/b14237/dynviews_2088.htm
This component monitors the total number of sessions blocked by other sessions.
Unit: Count
Source: https://docs.oracle.com/cd/E11882_01/server.112/e40402/dynviews_3017.htm
This component monitors the total number of active connections at any point.
Unit: Count
Sources:
https://docs.oracle.com/cd/B19306_01/server.102/b14237/dynviews_2088.htm
https://docs.oracle.com/cd/B19306_01/server.102/b14237/dynviews_2129.htm
https://docs.oracle.com/cd/B28359_01/server.111/b28320/dynviews_2098.htm
This component monitors the total number of incoming request per second. A high number of requests might be a reason for slow response.
Unit: Count/second
Source: https://docs.oracle.com/cd/E11882_01/server.112/e40402/dynviews_3090.htm
- Database Size (size of all tablespaces)
This component monitors the total database size (size of all table spaces) of the Oracle Database. The default value is fetched in bytes.
Unit: Bytes
Sources:
https://docs.oracle.com/cd/B19306_01/server.102/b14237/statviews_3122.htm
https://docs.oracle.com/cd/B19306_01/server.102/b14237/statviews_3083.htm
- Database Used Space (amount actually used)
This component monitors the total database used space.
Unit: Bytes
Sources:
https://docs.oracle.com/cd/B19306_01/server.102/b14237/statviews_3122.htm
https://docs.oracle.com/cd/B19306_01/server.102/b14237/statviews_3083.htm
- SQL Parse to execute ratio
This component monitors SQL parsing to execute ratio.
The query below will calculate the ratio by dividing parse count by execution count. A higher ratio means better performance.
Unit: Percent
Source: https://docs.oracle.com/cd/B28359_01/server.111/b28320/dynviews_3086.htm
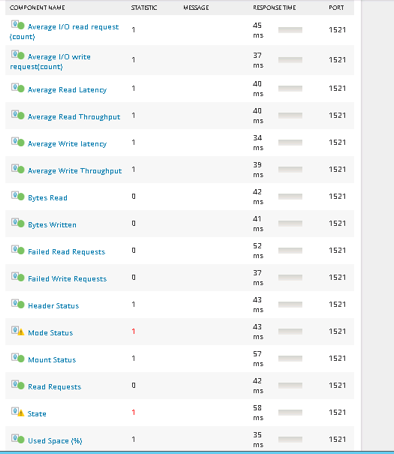
Oracle Automatic Storage Management:
https://thwack.solarwinds.com/docs/DOC-203310
This template contains newly added performance and statistics counters for Oracle ASM.
Prerequisites: Oracle client installed on the Orion SAM server. This is available from the SolarWinds customer portal[TK5] under Additional Downloads.
Credentials: An Oracle username and password with read access to the Oracle tables.
MONITORED COMPONENTS
Components without predetermined threshold values provide guidance such as "Use the lowest threshold possible" or "Use the highest threshold possible" to help you find an appropriate threshold for your application. For more information, see http://knowledgebase.solarwinds.com/kb/questions/2415.
This component monitor fetches the value for average write throughput for all disks under ASM disk group. The returned value will only show the results since the last polling period.
Unit: MB/second
Source: https://docs.oracle.com/cd/B19306_01/server.102/b14237/dynviews_1019.htm#REFRN30170
This component monitor fetches the value for average read throughput for all disks under ASM disk group. The returned value will only show the results since the last polling period.
Unit: MB/second
Source: https://docs.oracle.com/cd/B19306_01/server.102/b14237/dynviews_1019.htm#REFRN30170
This component monitor fetches the value for average write latency per MB for all disks under ASM disk group, at any time. The returned value will only show the results since the last polling period.
Unit: Milliseconds
Source: https://docs.oracle.com/cd/B19306_01/server.102/b14237/dynviews_1019.htm#REFRN30170
This component monitor fetches the value for average read latency per read request for all disks under ASM disk group, at any time. The returned value will only show the results since the last polling period.
Unit: Milliseconds
Source: https://docs.oracle.com/cd/B19306_01/server.102/b14237/dynviews_1019.htm#REFRN30170
This component monitors average number of I/O read requests for the disk group. The returned value will only show the results since the last polling period.
Unit: Count.
Source: https://docs.oracle.com/cd/B19306_01/server.102/b14237/dynviews_1019.htm#REFRN30170
- average i/o write request
This component monitors average number of I/O write requests for the disk group. The returned value will only show the results since the last polling period.
Unit: Count.
Source: https://docs.oracle.com/cd/B19306_01/server.102/b14237/dynviews_1019.htm#REFRN30170
Oracle Dataguard:
https://thwack.solarwinds.com/docs/DOC-203308
This template contains performance and statistics counters for Oracle Dataguard.
Prerequisites: Oracle client installed on the Orion SAM server. This is available from the SolarWinds customer portal[TK6] under Additional Downloads.
Credentials: An Oracle username and password with read access to the Oracle tables.
MONITORED COMPONENTS
Components without predetermined threshold values provide guidance such as "Use the lowest threshold possible" or "Use the highest threshold possible" to help you find an appropriate threshold for your application. For more information, see http://knowledgebase.solarwinds.com/kb/questions/2415
This component monitors the number of logs the secondary server has not yet applied.
The greater the value, the lower the protection. The returned value will only show the results since the last polling period.
Unit: Count
Source:
https://docs.oracle.com/cd/B14117_01/server.101/b10755/dynviews_1126.htm
https://docs.oracle.com/cd/B14117_01/server.101/b10755/dynviews_1011.htm
https://docs.oracle.com/cd/B13789_01/server.101/b10755/dynviews_1015.htm
https://docs.oracle.com/cd/B13789_01/server.101/b10755/dynviews_1054.htm
This component monitors how long it is taking the secondary to apply logs.
The returned value will only show the results since the last polling period.
Unit: Seconds
Source:
https://docs.oracle.com/cd/B14117_01/server.101/b10755/dynviews_1126.htm
https://docs.oracle.com/cd/B14117_01/server.101/b10755/dynviews_1011.htm
https://docs.oracle.com/cd/B13789_01/server.101/b10755/dynviews_1015.htm
https://docs.oracle.com/cd/B13789_01/server.101/b10755/dynviews_1054.htm
This component monitors the count of error(s) that have occurred on any of the destinations while applying redo logs.
Unit: Count
Source:
https://docs.oracle.com/cd/B13789_01/server.101/b10755/dynviews_1061.htm
https://docs.oracle.com/cd/B14117_01/server.101/b10755/dynviews_1011.htm
The SolarWinds trademarks, service marks, and logos are the exclusive property of SolarWinds Worldwide, LLC or its affiliates. All other trademarks are the property of their respective owners.