Description
CPU and Memory utilization are not base metrics in DPA's Resource tab for MySQL because the data is not available from within the database. However, by loading data periodically from the O/S into a table, we can make CPU and Memory information available so DPA can query it. If your MySQL database is running on Linux, there is a file name /proc/loadavg that provides CPU information, and /proc/meminfo that provides Memory information.
Note: if you are using Windows, Performance Monitor (perfmon) can be used to create a file and publish any metrics needed to a file. In this case, modify the table definitions and load process below as needed.
O/S CPU and Memory Files (Linux)
There are two files available in Linux that provide CPU and Memory data. The contents of these files are as follows:
# cat /proc/loadavg0.75 0.35 0.25 1/25 1747<br />
This file contains everything in a single line and the first three numbers are averages for the last minute, 5 minutes and 15 minutes. The fourth field represent the number of currently executing processes and threads while the last number is the PID of the most recently created process. We will use the first data point in this example.
# cat /proc/meminfo
MemTotal: 4018396 kB
MemFree: 286568 kB
MemAvailable: 2900672 kB
This file contains about 50 lines of various memory data and the first two lines contain the total memory available and the memory that is currently free. The first two lines will be used in this example.
Loading CPU and Memory Data into MySQL
For DPA to read this information, we need to load it into a table within MySQL with the following steps:
- Tables - In the first section of the attached script are the definitions of the tables.
- Load Data - To load the data once per minute, create a crontab entry to execute the TRUNCATE TABLE and LOAD DATA commands and an example is shown in the second section of the attachment.
- Crontab - To load the data every minute the third section in the attached file shows an example of the crontab entries. The copy commands (cp) are needed because MySQL can only load data from files located in the /var/lib/mysql-files directory by default. You can also change the MySQL variable named "secure_file_priv" to include the /proc directory as well to avoid the copy step.
- Note that the above steps need to be done on each Linux server you are monitoring with DPA.
DPA Metric Queries
Now that that data is being loaded from the O/S once every minute, DPA can query the information once per minute via a custom metric. The queries to use within these custom metrics in DPA are as follow:
CPU
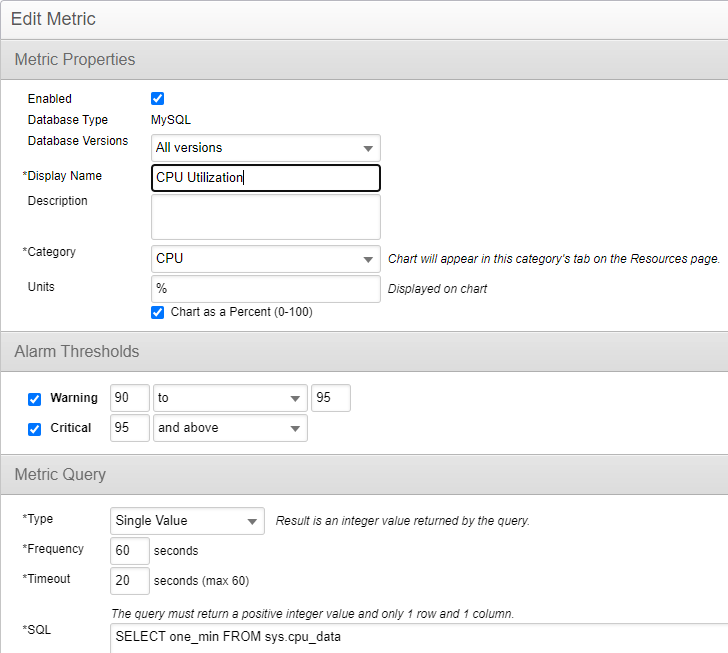
SELECT one_min FROM sys.cpu_data;
Memory
The free and total memory values appear in different lines in this file, so do a self join to get both values in the same query:
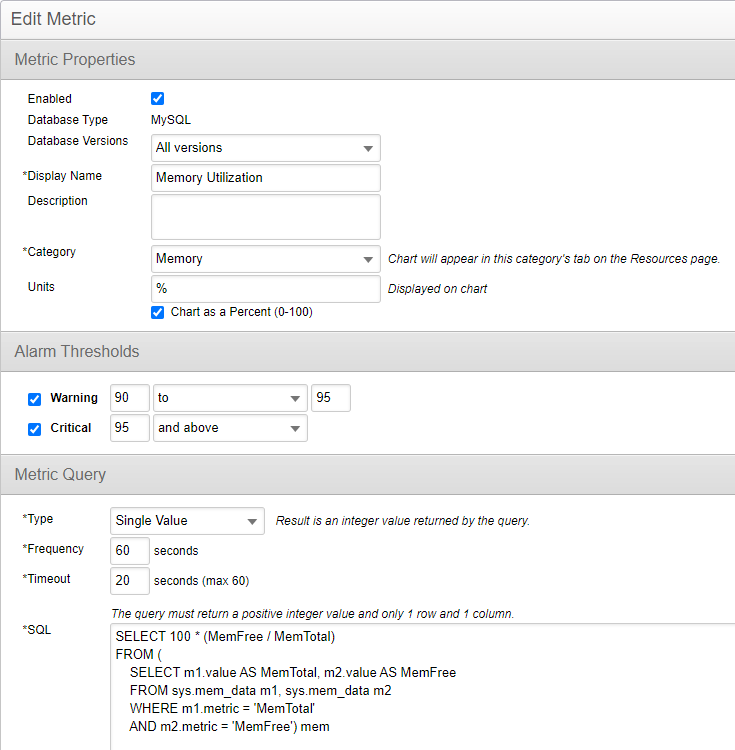
SELECT 100*(MemFree / MemTotal)
FROM (
SELECT m1.value AS MemTotal, m2.value AS MemFree
FROM sys.mem_data m1, sys.mem_date m2
WHERE m1.metric = 'MemTotal'
AND m2.metric = 'MemFree') mem
DPA Custom Metrics
With these queries, create custom metrics in DPA to produce CPU and Memory Charts in the Resources tab. With these custom metrics, Resource Alerts can also be created to get emails when CPU and Memory exceed thresholds. Click on Options > Custom Metrics to create them and they should look similar to this:

