So while we all await both the release of hopefully a native widget and more integration with Orion I thought why not make a widget showcasing what the new modern dashboard can look like?
To start with getting this info in Orion go to "add a node"
- Add a node with address: api.pingdom.com.
- Set the node to "external" (this way it won't alert you if it goes down).
- Click submit.
- You'll now be looking at the node view. Hit the "API Poller Management" button and create a new one.
- In the next screen enter "https://api.pingdom.com/api/3.1/checks" under Request URL.
- Head over to https://my.pingdom.com/app/api-tokens and click "Add API Token".
- Choose read only.
- Copy down the API token someplace safe.
- Under Headers fill in "Authorization" under name and then "Bearer <your API token>"
- Click "Send Request".
- You should now see a nice array of metrics.
- Click on "checks" to expand it.
- Choose to monitor lastresponsetime for each separate check under the array.

- The list of what's monitored will populate on the right side of the screen.
- When you're done click "save".
- Now you'll note a new block on the api.pingdom.com node called "API Pollers" that should have each one of your checks listed with ping displayed.
- Head over to your new "modern dashboard" you want a pingdom widget displayed on.
- Create a new Table widget.
- Name it.
- Use the following SWQL Query to display that poller (change the "TOP 10" to match the number of monitors you ended up with):
SELECT TOP 10 DisplayName, ThresholdRule, DetailsUrl, Metric, Status FROM Cortex.Orion.ApiPoller.ValueToMonitor WHERE RelatedAPiPoller = <pollerID that shows in the url for the API poll e.g. 45422>
- Now let's populate it!
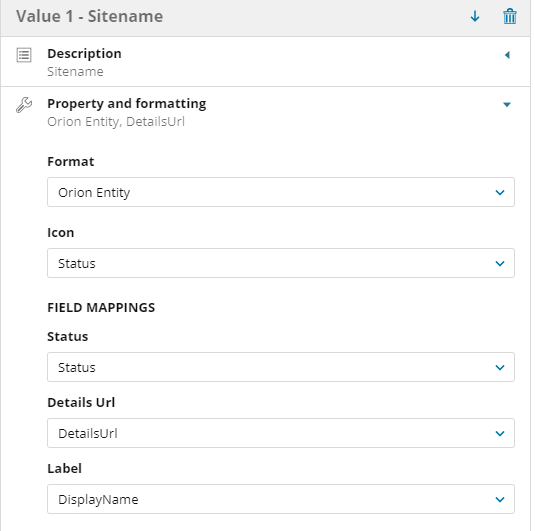
- Value 1 - Sitename (or whatever label you'd prefer)

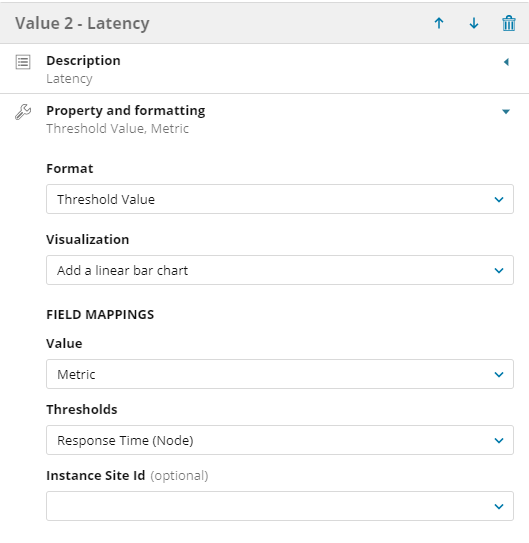
- Add a new value. Name it "Latency"

- Make sure everything in the preview looks right and then click save.
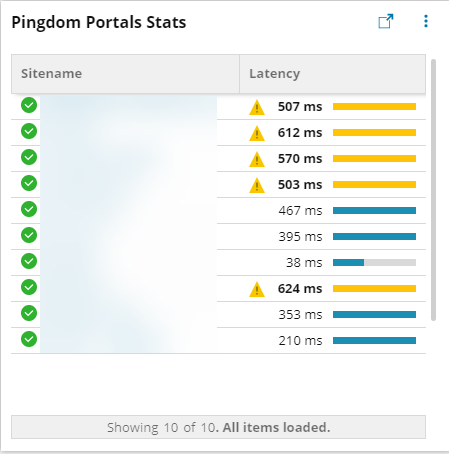
When it's all said and done you now have:

- Status of up/down shown as an icon next to the clickable displayname of each monitor
- Latency, complete with a linear graph.
- Thresholds that warn when pings get a little too high.