As the title states, I will attempt to show you how to build quick, and simple, PerfStack templates using SWQL queries. My intent is to keep it simple here, so I will NOT be going into anything that requires you to be a world class rocket surgeon.
Here is an easy way to build a list of saved PerfStack projects: Building Simple PerfStack Project Lists With SWQL
Basically, I just need a quick and easy way to build PerfStack views in bulk. When manually building a PerfStack dashboard, you are actually building the URL as you are adding the various metrics. I am simply taking that URL, and stamping it out across all nodes at once. I want to be able to build a handful of templates, to allow my team to quickly troubleshoot issues as they are occurring. I do NOT want to have someone building a PerfStack dashboard during the outage. I do, however, want them to have access to this super awesome tool, but it needs to be useful in the heat of battle. I think we will all get there, in time, but maybe this will work for now...?
Okay, in the spirit of keeping it simple, let's just start things out with a few metrics per node. More specifically, I am going to build a template that shows me the basic metrics for CPU, memory, response time, alerts, and events. Now, let's break this down...
Example NodeID: 1234
CPU
Orion.CPULoad.MinLoad
Orion.CPULoad.MaxLoad
Orion.CPULoad.AvgLoad
If you go through the steps to manually create your PerfStack dashboard, you would need to do the following:
Select the node you want.
Select the type of metrics you want.
Drag each node metric over to the graph section you want.
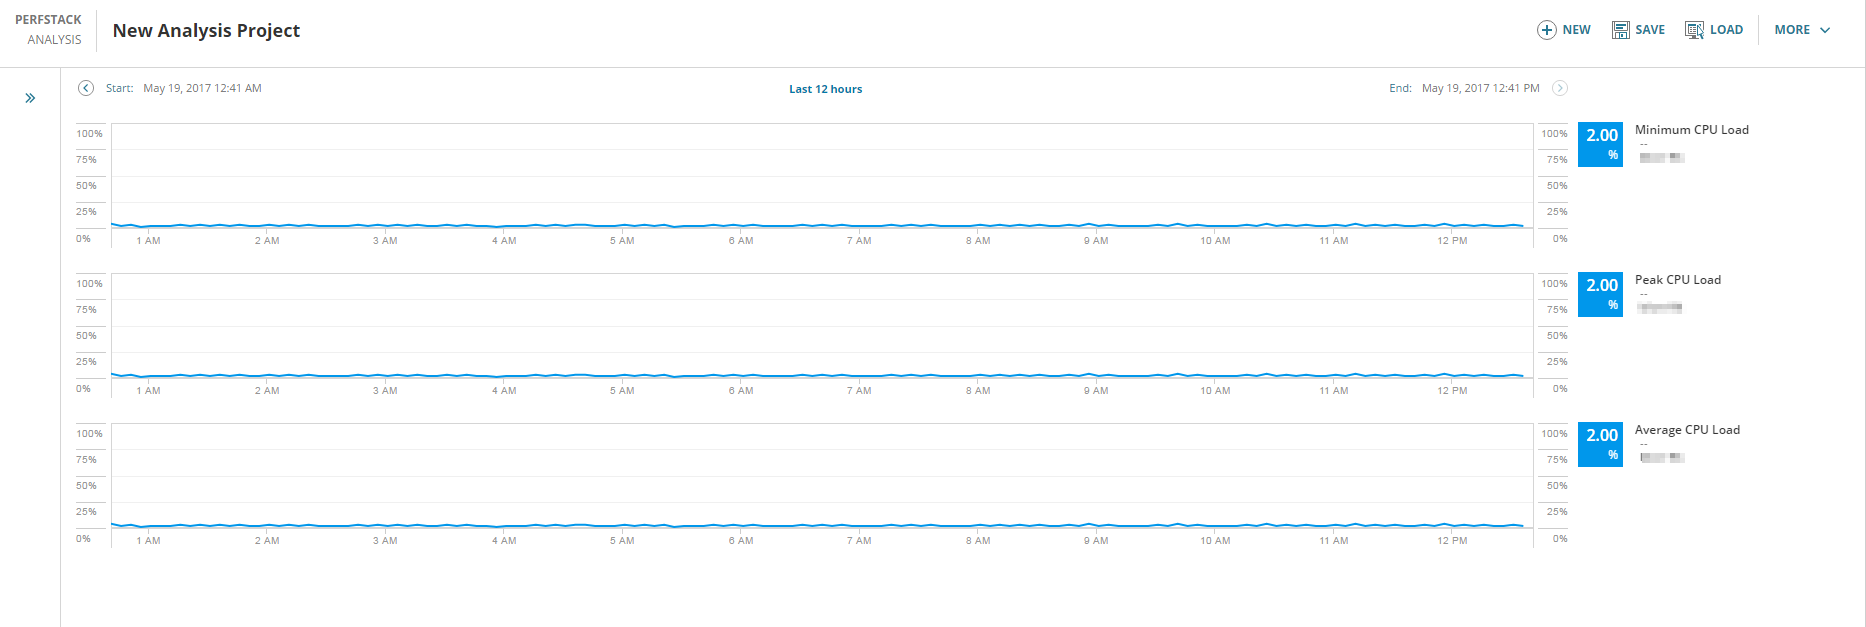
Using the min, max, avg cpu load metrics, on our example node (nodeid=1234), and having each on its own graph box, your URL would look something similar to this:
http://{orionserver}/ui/perfstack/?presetTime=last12Hours&charts=0_Orion.Nodes_1234-Orion.CPULoad.MinLoad;0_Orion.Nodes_1234-Orion.CPULoad.MaxLoad;0_Orion.Nodes_1234-Orion.CPULoad.AvgLoad;
And your PerfStack dashboard would look something like this:

All in all, pretty simple and easy to do.
Now, would you want to do that for each of the 1500, 5000, or 10000+ nodes you are monitoring? If so, I reckon there is no need for you to keep reading. In fact, you best get back to mass producing those graphs on your one person assembly line. For the rest of us, let's look at a simple solution.
Add a "Custom Query" resource to a summary page, and then add the following query into the resource.
SELECT
Caption
,'PerfStack_Template_A' AS [PerfStack-A]
,'/ui/perfstack/?presetTime=last12Hours&charts=0_Orion.Nodes_' + TOSTRING(NodeID) + '-Orion.CPULoad.MinLoad;0_Orion.Nodes_' + TOSTRING(NodeID) + '-Orion.CPULoad.MaxLoad;0_Orion.Nodes_' + TOSTRING(NodeID) + '-Orion.CPULoad.AvgLoad;' AS [_LinkFor_PerfStack-A]
FROM Orion.Nodes
And, to make things a bit easier to navigate, enable the search option, and drop in the following query: (This is certainly not required, but will surely assist in tracking down the node you want to investigate.)
SELECT
Caption
,'PerfStack_Template_A' AS [PerfStack-A]
,'/ui/perfstack/?presetTime=last12Hours&charts=0_Orion.Nodes_' + TOSTRING(NodeID) + '-Orion.CPULoad.MinLoad;0_Orion.Nodes_' + TOSTRING(NodeID) + '-Orion.CPULoad.MaxLoad;0_Orion.Nodes_' + TOSTRING(NodeID) + '-Orion.CPULoad.AvgLoad;' AS [_LinkFor_PerfStack-A]
FROM Orion.Nodes
WHERE
Caption LIKE '%${SEARCH_STRING}%'
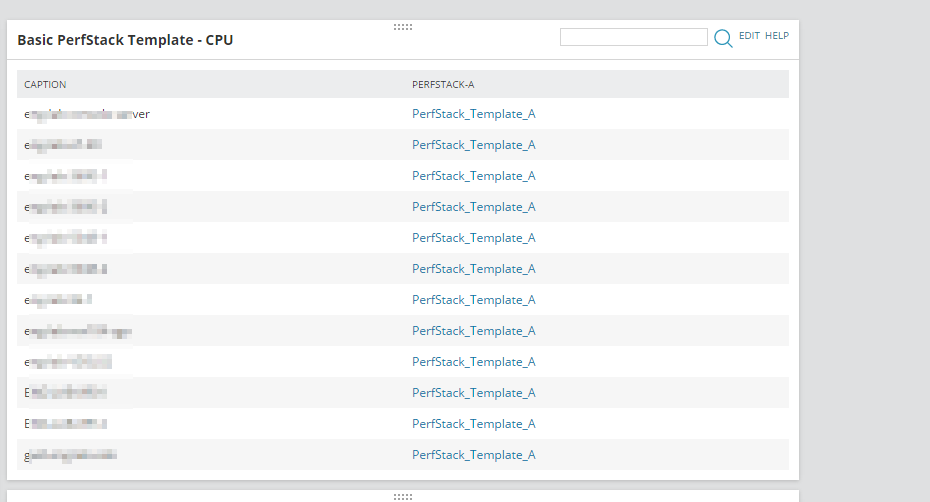
After saving/submitting your resource, you should see something that looks like this:

See, nothing fancy... Just a simple little node search box, with a link to something.
Now check out what in one of those links...

Hmm... That looks awfully familiar... Only... You didn't have to build anything... And, whats more, it's already built for EVERY node you are monitoring.
Okay, I admit, that graph template is not all that impressive, and probably not worth much of anything... However, (yeah, there's always a however...) we can easily make a couple of changes, which should make this more helpful.
Instead of having each different CPU metric on its own graph box, let's group all 3 of them together in the same box.
This is easily accomplished by changing the inner semicolons to commas.
SELECT
Caption
,'PerfStack_Template_A' AS [PerfStack-A]
,'/ui/perfstack/?presetTime=last12Hours&charts=0_Orion.Nodes_' + TOSTRING(NodeID) + '-Orion.CPULoad.MinLoad,0_Orion.Nodes_' + TOSTRING(NodeID) + '-Orion.CPULoad.MaxLoad,0_Orion.Nodes_' + TOSTRING(NodeID) + '-Orion.CPULoad.AvgLoad;' AS [_LinkFor_PerfStack-A]
FROM Orion.Nodes
After changing those 2 semicolons to commas, this is what our graph looks like: (since the min, max, & avg are all the same, our graph looks pretty well hidden, but as you can see on the right side, all 3 metrics are still there.)

Now, let's add some more stuff, and finish this thing up...
We are going to add the remaining items from our initial list (memory, response time, alerts, & events)
To show our progress, we are going to add new lines to our query, keeping the first draft the same. This will give us the ability to build different templates, and access them from a central place.
We are going to keep similar metrics together in the same graph box, as we did with the CPU Load metrics. We will end up with a single graph box which contains all of the CPU Load metrics, another with memory, another with response time, etc..
You are simply taking each of the individual metrics groups, and combining them together, into a single URL.
Use a comma to keep metrics in the same graph box, and use a semicolon to end the selection of each graph box.
Using the example below, first remove all of the lines that start with "--", as well as all blank/empty lines.
--CPU Load:
,'/ui/perfstack/?presetTime=last12Hours&charts=
0_Orion.Nodes_' + TOSTRING(NodeID) + '-Orion.CPULoad.MinLoad,
0_Orion.Nodes_' + TOSTRING(NodeID) + '-Orion.CPULoad.MaxLoad,
0_Orion.Nodes_' + TOSTRING(NodeID) + '-Orion.CPULoad.AvgLoad;

--Memory:
0_Orion.Nodes_' + TOSTRING(NodeID) + '-Orion.CPULoad.TotalMemory,
0_Orion.Nodes_' + TOSTRING(NodeID) + '-Orion.CPULoad.MinMemoryUsed,
0_Orion.Nodes_' + TOSTRING(NodeID) + '-Orion.CPULoad.MaxMemoryUsed,
0_Orion.Nodes_' + TOSTRING(NodeID) + '-Orion.CPULoad.AvgMemoryUsed;

--ResponseTime:
0_Orion.Nodes_' + TOSTRING(NodeID) + '-Orion.ResponseTime.AvgResponseTime,
0_Orion.Nodes_' + TOSTRING(NodeID) + '-Orion.ResponseTime.MinResponseTime,
0_Orion.Nodes_' + TOSTRING(NodeID) + '-Orion.ResponseTime.MaxResponseTime,
0_Orion.Nodes_' + TOSTRING(NodeID) + '-Orion.ResponseTime.Availability;

--Alerts & Events:
0_Orion.Nodes_' + TOSTRING(NodeID) + '-Orion.PerfStack.Alerts,
0_Orion.Nodes_' + TOSTRING(NodeID) + '-Orion.PerfStack.Events;'
Then, just backspace the lines together, starting from the last row, and going up, until they look like this:
,'/ui/perfstack/?presetTime=last12Hours&charts=0_Orion.Nodes_' + TOSTRING(NodeID) + '-Orion.CPULoad.MinLoad,0_Orion.Nodes_' + TOSTRING(NodeID) + '-Orion.CPULoad.MaxLoad,0_Orion.Nodes_' + TOSTRING(NodeID) + '-Orion.CPULoad.AvgLoad;0_Orion.Nodes_' + TOSTRING(NodeID) + '-Orion.CPULoad.TotalMemory,0_Orion.Nodes_' + TOSTRING(NodeID) + '-Orion.CPULoad.MinMemoryUsed,0_Orion.Nodes_' + TOSTRING(NodeID) + '-Orion.CPULoad.MaxMemoryUsed,0_Orion.Nodes_' + TOSTRING(NodeID) + '-Orion.CPULoad.AvgMemoryUsed;0_Orion.Nodes_' + TOSTRING(NodeID) + '-Orion.ResponseTime.AvgResponseTime,0_Orion.Nodes_' + TOSTRING(NodeID) + '-Orion.ResponseTime.MinResponseTime,0_Orion.Nodes_' + TOSTRING(NodeID) + '-Orion.ResponseTime.MaxResponseTime,0_Orion.Nodes_' + TOSTRING(NodeID) + '-Orion.ResponseTime.Availability;0_Orion.Nodes_' + TOSTRING(NodeID) + '-Orion.PerfStack.Alerts,0_Orion.Nodes_' + TOSTRING(NodeID) + '-Orion.PerfStack.Events;'
Finally, just add that newly combined row to your query, which will then look like this: (Don't forget to add your SWQL _LinkFor_ alias to the end of the line, so it matches the alias name)
SELECT
Caption
,'PerfStack_Template_A' AS [PerfStack-A]
,'/ui/perfstack/?presetTime=last12Hours&charts=0_Orion.Nodes_' + TOSTRING(NodeID) + '-Orion.CPULoad.MinLoad,0_Orion.Nodes_' + TOSTRING(NodeID) + '-Orion.CPULoad.MaxLoad,0_Orion.Nodes_' + TOSTRING(NodeID) + '-Orion.CPULoad.AvgLoad;' AS [_LinkFor_PerfStack-A]

,'PerfStack_Template_Z' AS [PerfStack-Z]
,'/ui/perfstack/?presetTime=last12Hours&charts=0_Orion.Nodes_' + TOSTRING(NodeID) + '-Orion.CPULoad.MinLoad,0_Orion.Nodes_' + TOSTRING(NodeID) + '-Orion.CPULoad.MaxLoad,0_Orion.Nodes_' + TOSTRING(NodeID) + '-Orion.CPULoad.AvgLoad;0_Orion.Nodes_' + TOSTRING(NodeID) + '-Orion.CPULoad.TotalMemory,0_Orion.Nodes_' + TOSTRING(NodeID) + '-Orion.CPULoad.MinMemoryUsed,0_Orion.Nodes_' + TOSTRING(NodeID) + '-Orion.CPULoad.MaxMemoryUsed,0_Orion.Nodes_' + TOSTRING(NodeID) + '-Orion.CPULoad.AvgMemoryUsed;0_Orion.Nodes_' + TOSTRING(NodeID) + '-Orion.ResponseTime.AvgResponseTime,0_Orion.Nodes_' + TOSTRING(NodeID) + '-Orion.ResponseTime.MinResponseTime,0_Orion.Nodes_' + TOSTRING(NodeID) + '-Orion.ResponseTime.MaxResponseTime,0_Orion.Nodes_' + TOSTRING(NodeID) + '-Orion.ResponseTime.Availability;0_Orion.Nodes_' + TOSTRING(NodeID) + '-Orion.PerfStack.Alerts,0_Orion.Nodes_' + TOSTRING(NodeID) + '-Orion.PerfStack.Events;' AS [_LinkFor_PerfStack-Z]

FROM Orion.Nodes
The End Result:
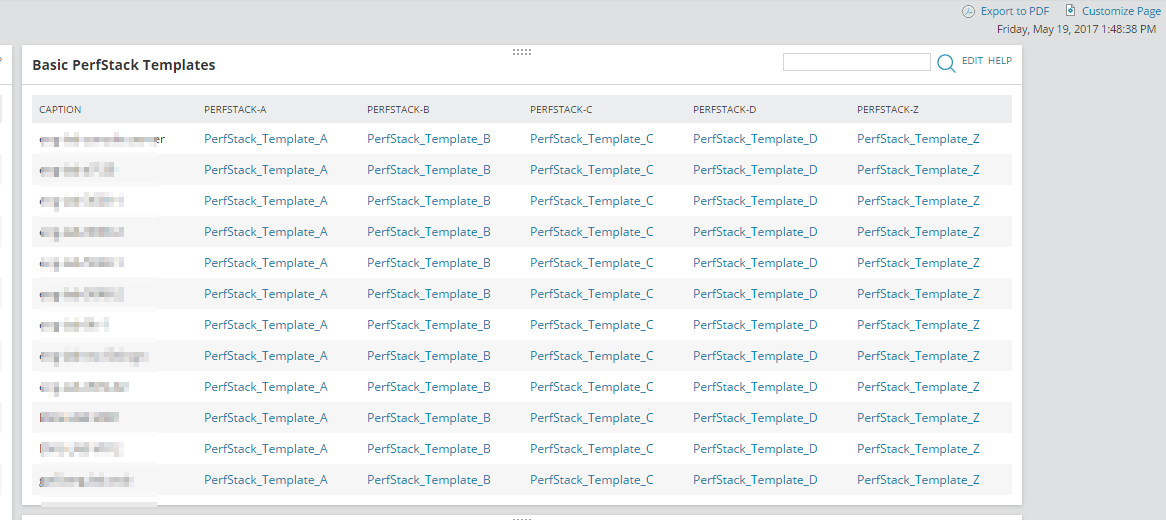
Here is my simple little SWQL query that will give you examples for each of the different basic metric types we used in the many, many, many words above.
PerfStack-A = CPU Load
PerfStack-B = Memory Used
PerfStack-C = Response Time
PerfStack-D = Alerts & Events
PerfStack-Z = All of the above
SELECT
Caption
,'PerfStack_Template_A' AS [PerfStack-A]
,'/ui/perfstack/?presetTime=last12Hours&charts=0_Orion.Nodes_' + TOSTRING(NodeID) + '-Orion.CPULoad.MinLoad,0_Orion.Nodes_' + TOSTRING(NodeID) + '-Orion.CPULoad.MaxLoad,0_Orion.Nodes_' + TOSTRING(NodeID) + '-Orion.CPULoad.AvgLoad;' AS [_LinkFor_PerfStack-A]

,'PerfStack_Template_B' AS [PerfStack-B]
,'/ui/perfstack/?presetTime=last12Hours&charts=0_Orion.Nodes_' + TOSTRING(NodeID) + '-Orion.CPULoad.TotalMemory,0_Orion.Nodes_' + TOSTRING(NodeID) + '-Orion.CPULoad.MinMemoryUsed,0_Orion.Nodes_' + TOSTRING(NodeID) + '-Orion.CPULoad.MaxMemoryUsed,0_Orion.Nodes_' + TOSTRING(NodeID) + '-Orion.CPULoad.AvgMemoryUsed;' AS [_LinkFor_PerfStack-B]

,'PerfStack_Template_C' AS [PerfStack-C]
,'/ui/perfstack/?presetTime=last12Hours&charts=0_Orion.Nodes_' + TOSTRING(NodeID) + '-Orion.ResponseTime.AvgResponseTime,0_Orion.Nodes_' + TOSTRING(NodeID) + '-Orion.ResponseTime.MinResponseTime,0_Orion.Nodes_' + TOSTRING(NodeID) + '-Orion.ResponseTime.MaxResponseTime,0_Orion.Nodes_' + TOSTRING(NodeID) + '-Orion.ResponseTime.Availability;' AS [_LinkFor_PerfStack-C]

,'PerfStack_Template_D' AS [PerfStack-D]
,'/ui/perfstack/?presetTime=last12Hours&charts=0_Orion.Nodes_' + TOSTRING(NodeID) + '-Orion.PerfStack.Alerts,0_Orion.Nodes_' + TOSTRING(NodeID) + '-Orion.PerfStack.Events;' AS [_LinkFor_PerfStack-D]

,'PerfStack_Template_Z' AS [PerfStack-Z]
,'/ui/perfstack/?presetTime=last12Hours&charts=0_Orion.Nodes_' + TOSTRING(NodeID) + '-Orion.CPULoad.MinLoad,0_Orion.Nodes_' + TOSTRING(NodeID) + '-Orion.CPULoad.MaxLoad,0_Orion.Nodes_' + TOSTRING(NodeID) + '-Orion.CPULoad.AvgLoad;0_Orion.Nodes_' + TOSTRING(NodeID) + '-Orion.CPULoad.TotalMemory,0_Orion.Nodes_' + TOSTRING(NodeID) + '-Orion.CPULoad.MinMemoryUsed,0_Orion.Nodes_' + TOSTRING(NodeID) + '-Orion.CPULoad.MaxMemoryUsed,0_Orion.Nodes_' + TOSTRING(NodeID) + '-Orion.CPULoad.AvgMemoryUsed;0_Orion.Nodes_' + TOSTRING(NodeID) + '-Orion.ResponseTime.AvgResponseTime,0_Orion.Nodes_' + TOSTRING(NodeID) + '-Orion.ResponseTime.MinResponseTime,0_Orion.Nodes_' + TOSTRING(NodeID) + '-Orion.ResponseTime.MaxResponseTime,0_Orion.Nodes_' + TOSTRING(NodeID) + '-Orion.ResponseTime.Availability;0_Orion.Nodes_' + TOSTRING(NodeID) + '-Orion.PerfStack.Alerts,0_Orion.Nodes_' + TOSTRING(NodeID) + '-Orion.PerfStack.Events;' AS [_LinkFor_PerfStack-Z]

FROM Orion.Nodes
The SWQL query above should show you a resource similar to:

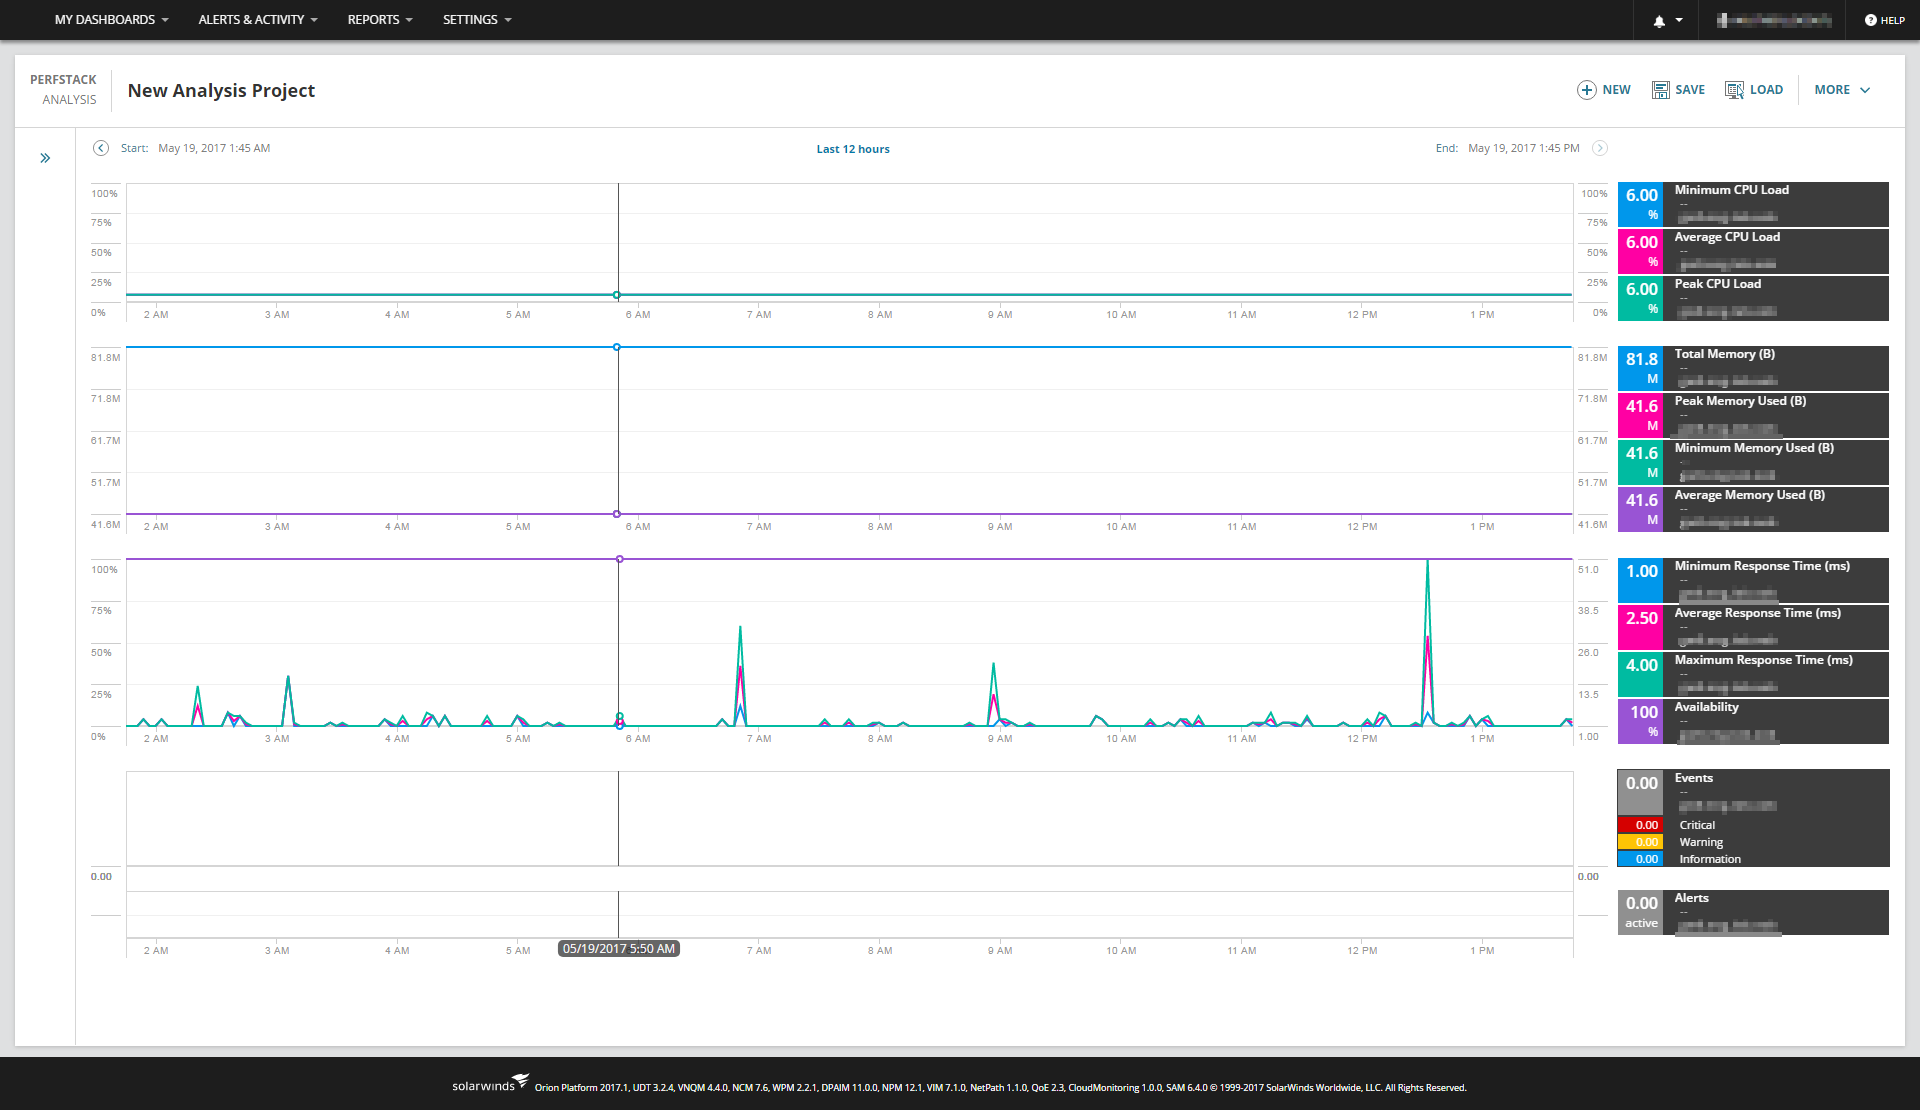
And the "PerfStack-Z" template should build out to something like this:

**There is really no need to save this dashboard (that I know of, anyway), as the link will just open up the same exact thing, every time. However, if you wanted to use this as a jumping off point, adding other metrics for other nodes/interfaces/etc., it would probably be best to save it.**
While this is really only building single node "templates", you can add multiple nodes to a single graph with a quick copy paste, or some decent SWQL skills (which I am obviously lacking, as I don't have any a multi-node query ready yet...).
For example, the following would show the Average CPU Load for NodeIDs 1234 & 5678, on the same graph box.
0_Orion.Nodes_1234-Orion.CPULoad.AvgLoad,0_Orion.Nodes_5678-Orion.CPULoad.AvgLoad;
There is a browser/URL limitation, so, eventually, once the URL gets too long, it will not work. I believe this is why they convert the URL into a stored name, to circumvent the issue. Having said that, if you do build a super long URL, just update the database directly. (insert buyer beware, backup early, backup often, etc... )
This is, by no means, the best way to accomplish bulk "pre-built" templates for troubleshooting. However, maybe it will hold you over until the next release of PerfStack...?
For more ways to customize your SolarWinds environment, make sure to check out this link, by CourtesyIT
How to do various customizations with your Solarwinds
Thank you,
-Will