How to make a pingdom widget in the new Orion Modern Dashboard (2020.2 RC)

So while we all await both the release of hopefully a native widget and more integration with Orion I thought why not make a widget showcasing what the new modern dashboard can look like?

To start with getting this info in Orion go to "add a node"

  1. Add a node with address: api.pingdom.com.

  2. Set the node to "external" (this way it won't alert you if it goes down).

  3. Click submit.

  4. You'll now be looking at the node view. Hit the "API Poller Management" button and create a new one.

  5. In the next screen enter "https://api.pingdom.com/api/3.1/checks" under Request URL.

  6. Head over to https://my.pingdom.com/app/api-tokens and click "Add API Token".

    1. Choose read only.
    2. Copy down the API token someplace safe.

  7. Under Headers fill in "Authorization" under name and then "Bearer <your API token>"

  8. Click "Send Request".

  9. You should now see a nice array of metrics.

  10. Click on "checks" to expand it.

  11. Choose to monitor lastresponsetime for each separate check under the array.
    monitorping.png

  12. The list of what's monitored will populate on the right side of the screen.

  13. When you're done click "save".

  14. Now you'll note a new block on the api.pingdom.com node called "API Pollers" that should have each one of your checks listed with ping displayed.

  15. Head over to your new "modern dashboard" you want a pingdom widget displayed on. 

  16. Create a new Table widget. 
    1. Name it.
    2. Use the following SWQL Query to display that poller (change the "TOP 10" to match the number of monitors you ended up with):
SELECT TOP 10 DisplayName, ThresholdRule, DetailsUrl, Metric, Status FROM Cortex.Orion.ApiPoller.ValueToMonitor​​ WHERE RelatedAPiPoller = <pollerID that shows in the url for the API poll e.g. 45422>


  • Now let's populate it!

  • Value 1 - Sitename (or whatever label you'd prefer)
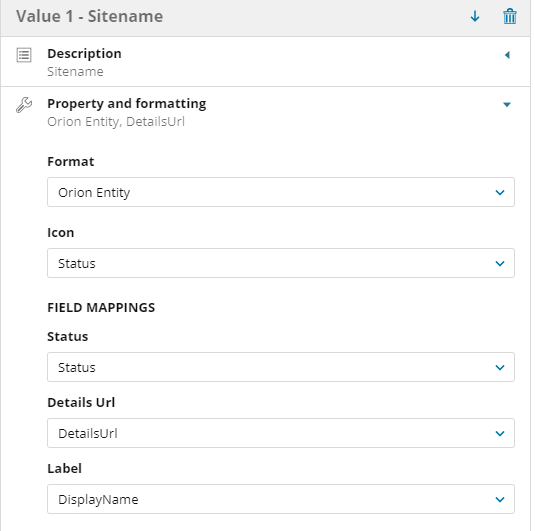
    value-sitename.png

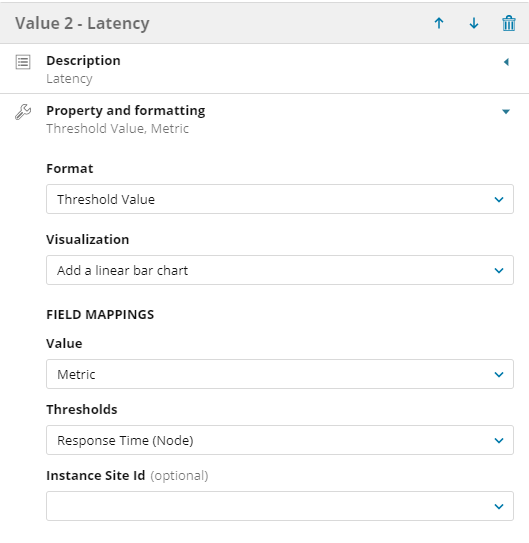
  1. Add a new value. Name it "Latency" 
    value-latency.png
  2. Make sure everything in the preview looks right and then click save. 

When it's all said and done you now have: 
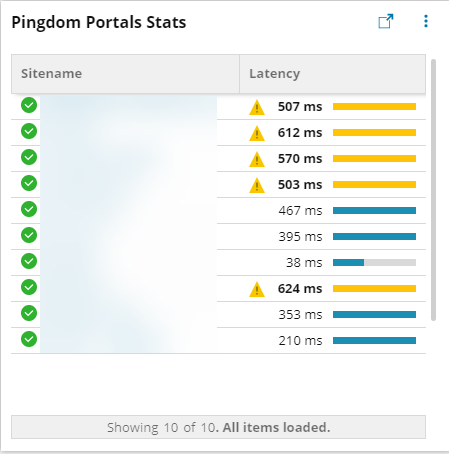
wigetdone.png

  • Status of up/down shown as an icon next to the clickable displayname of each monitor
  • Latency, complete with a linear graph.
  • Thresholds that warn when pings get a little too high.
  • For even faster Pingdom integration using the API poller, you can also choose to use the OOTB Pingdom API Poller template! 

    Under API Poller Management -> Click Assign 

    Search for Pingdom and you'll find the template there to help you monitor your transaction checks! 

    serena_0-1590186142599.png

  • Here's a "classic dashboard" widget. It autolinks to the perfstack data for each monitored check.

    Snag_53a0d996.png

    <div id="status_table" class="sw-rpt-tbl-frame">
    <script>
    
    //Pingdom Stats Widget 0.75 written by Chris O'Rourke May 22nd, 2020. 
    //Change the TOP count to match the number of displayed results you want. 
    	var swql="SELECT TOP 30 DisplayName, DetailsUrl, Metric, Status
    FROM Cortex.Orion.ApiPoller.ValueToMonitor WHERE RelatedApiPoller = <pollerID as shown in the api url>"
    
    	var params = JSON.stringify({
    		query: swql,
    		parameters: {
    		}
    	});
    	
    	$.ajax({
    		type: 'POST',
    		url: '/Orion/Services/Information.asmx/QueryWithParameters',
    		data: params,
    		contentType: "application/json; charset=utf-8",
    		dataType: "json",
    		success: function(response) {
    			//console.log(response.d.Rows);
    			
    			//Massage variables for output
    			var cleanVars = [];
    			for(var i=0; i < response.d.Rows.length; i++){
    				cleanVars[i] = {};
    				cleanVars[i]['service'] = response.d.Rows[i][0];
    				cleanVars[i]['link'] = response.d.Rows[i][1];
    				cleanVars[i]['ping'] = response.d.Rows[i][2];
    				cleanVars[i]['status'] = response.d.Rows[i][3];
    			}
    			//console.log(cleanVars);
    			
    			
    			//Initial Table and Headers
    			var statusTable = "<table class='sw-custom-query-table NeedsZebraStripes' style='table-layout: fixed; width: 100%;' cellpadding='2' cellspacing='0'>";
    			statusTable += "<thead><tr class='HeaderRow'>";
    			statusTable += "<th class='ReportHeader' style='font-weight: bold; font-size: 12px; text-align: left;'>Service</th>";
    			statusTable += "<th class='ReportHeader' style='font-weight: bold; font-size: 12px; text-align: left;'>Ping</th>";
    			statusTable += "</tr></thead>";
    			
    			//Add Services to Table
    			for(var i=0; i < cleanVars.length; i++){
    				statusTable += "<tr>";
    				
    				statusTable += "<td>";
    				
    				if (cleanVars[i]['status'] == '1'){
    					statusTable += "<img src='/Orion/images/StatusIcons/Small-up.gif' alt='Node Status Okay' style='vertical-align:bottom;margin-right:8px;'>";
    				} else {
    					statusTable += "<img src='/Orion/images/StatusIcons/Small-down.gif' alt='Node Status Down' style='vertical-align:bottom; margin-right:8px;'>";
    
    				}
    				
    				statusTable += "<a href='" + cleanVars[i]['link'] + "'>" + cleanVars[i]['service'] + "</a></td>";
    				
    				statusTable += "<td>" + cleanVars[i]['ping'] + " ms </td>";
    				
    				statusTable += "</tr>";
    				
    			}			
    			
    			
    			//Table Close
    			statusTable += "</table>";
    			
    			
    			//Grab Element from DOM and Write
    			var table = document.getElementById('status_table');
    			table.innerHTML = statusTable;
    		}
    	})
    </script>
    </div>
  •  I had no idea that functionality was there!  Any chance it can get it's own spot in the admin all settings page?

  • Great request and we're definitely looking to surface better management in the settings page. Not available yet in the 2020.2 release, but it's something we're thinking through how to best serve your needs there. Please continue to send feedback to us so we can progress!   is the PM for SAM going forward, so he'll be able to bring you into user research sessions regarding the topic. 

  • This is great. Just recently new to Solarwinds few months ago and we have sites registered in Pingdom but only browsing it through the web. Pretty cool it's can be included on the dashboard.

  • Hi, Is it working on 2020.2.4 ? I tried but "Cortex.Orion.ApiPoller.ValueToMonitor" table was not found. 

  • edit: It is indeed broken. At some point it changed over to another spot in the database and I'd corrected the widget in our production environment without updating my notes. 

    New location should be: 

    SELECT ID, RequestDetailsId, DisplayName, Path, WarningThreshold, CriticalThreshold, ThresholdRule, Type, StringToNumberTransformationOtherValues, DetailsUrl, Status, Metric, StatusDescription, StatusLED, Image, Description FROM Orion.APIPoller.ValueToMonitor WHERE RequestDetailsID = <yourAPInumberhere>
    The jquery will need changed however (we're not using the old dashboard widgets anymore so sadly I don't have the fixes handy to make it work again).
  • It seems the newest update broke both the threshold functionality as well as the pingdom default (new oob template is transactions only not uptime that I can see) as well as the widget doesn't allow "metric" to be selected as a threshold value.

    Seems the NPM and widget ui/ux team forgot to test pingdom functionality and compatibility.

  • I thought I was going crazy trying to get this to work, but if it's broken I won't waste any more time!  Disappointed

    I have been toying with this in 2020.2.6