Why Are We Reading This?
The following set of documents will show you how to create custom highcharts graphs/charts. Why would you need, or even want, to do this? Well, maybe you don't... Or, maybe you want to view some data from multiple systems together within SolarWinds... Or maybe you just want to go on an adventure to discover the flexibility of your SolarWinds environment. Whatever you reason(s) might be, this just might be a good place to start.
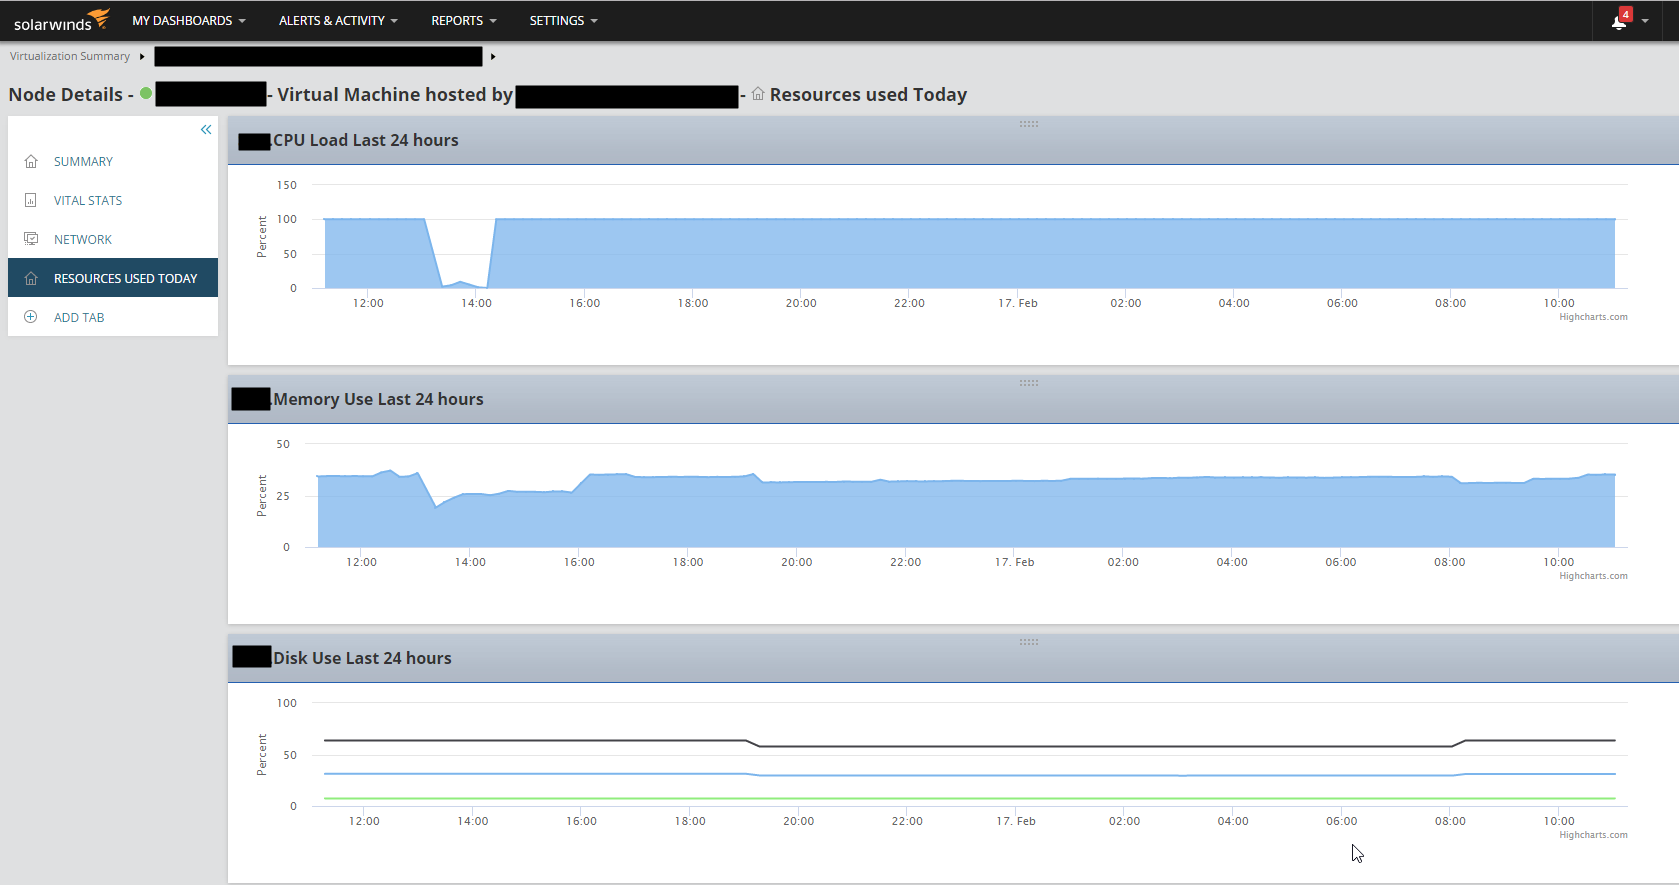
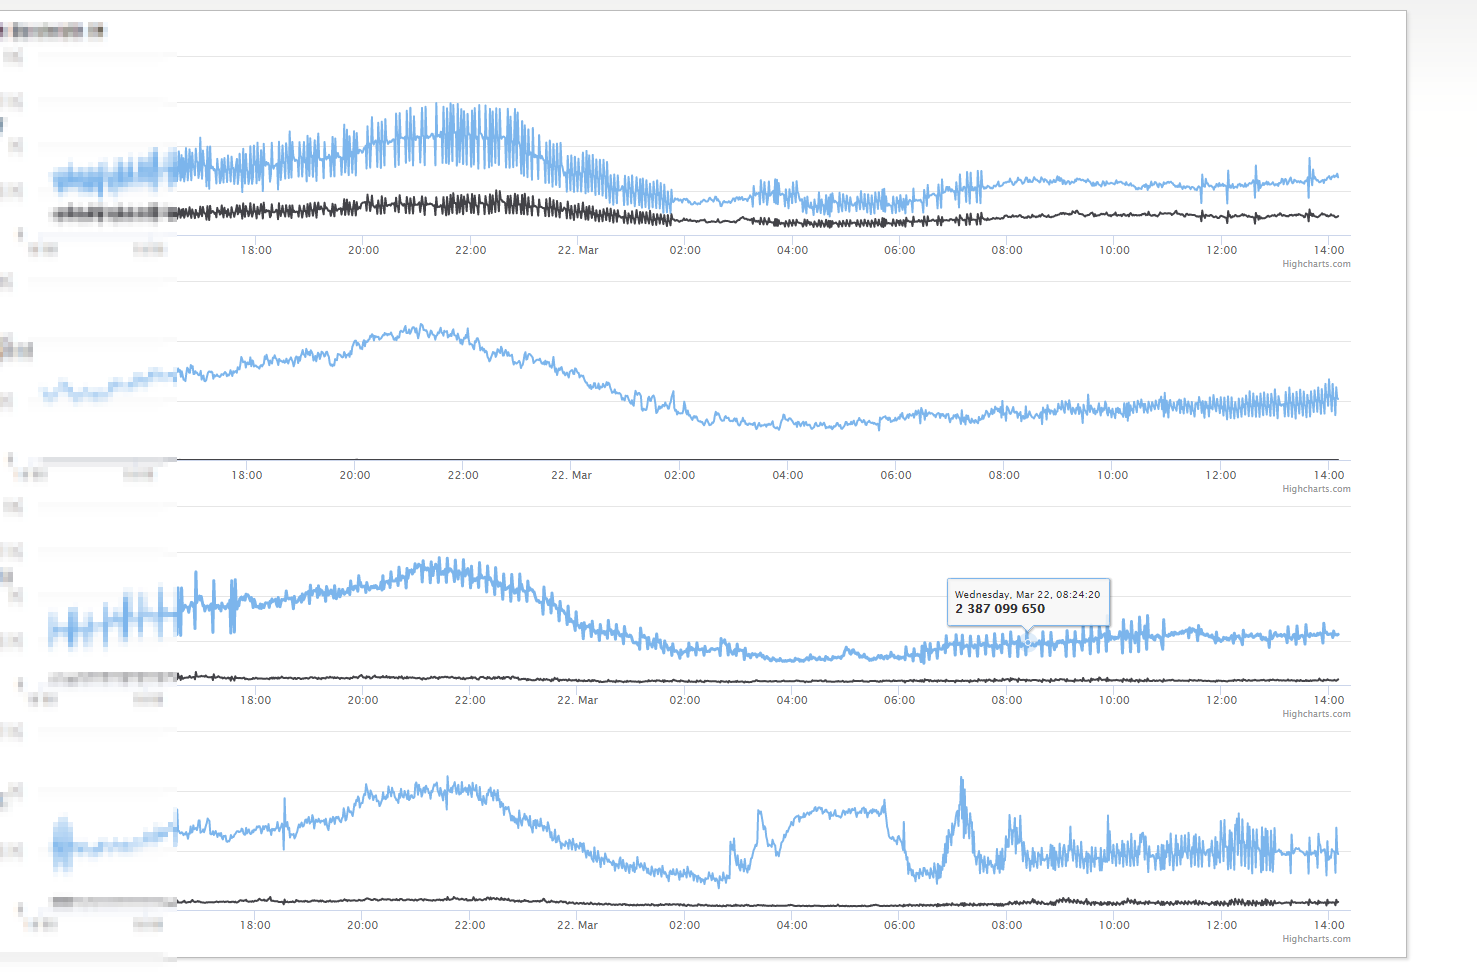
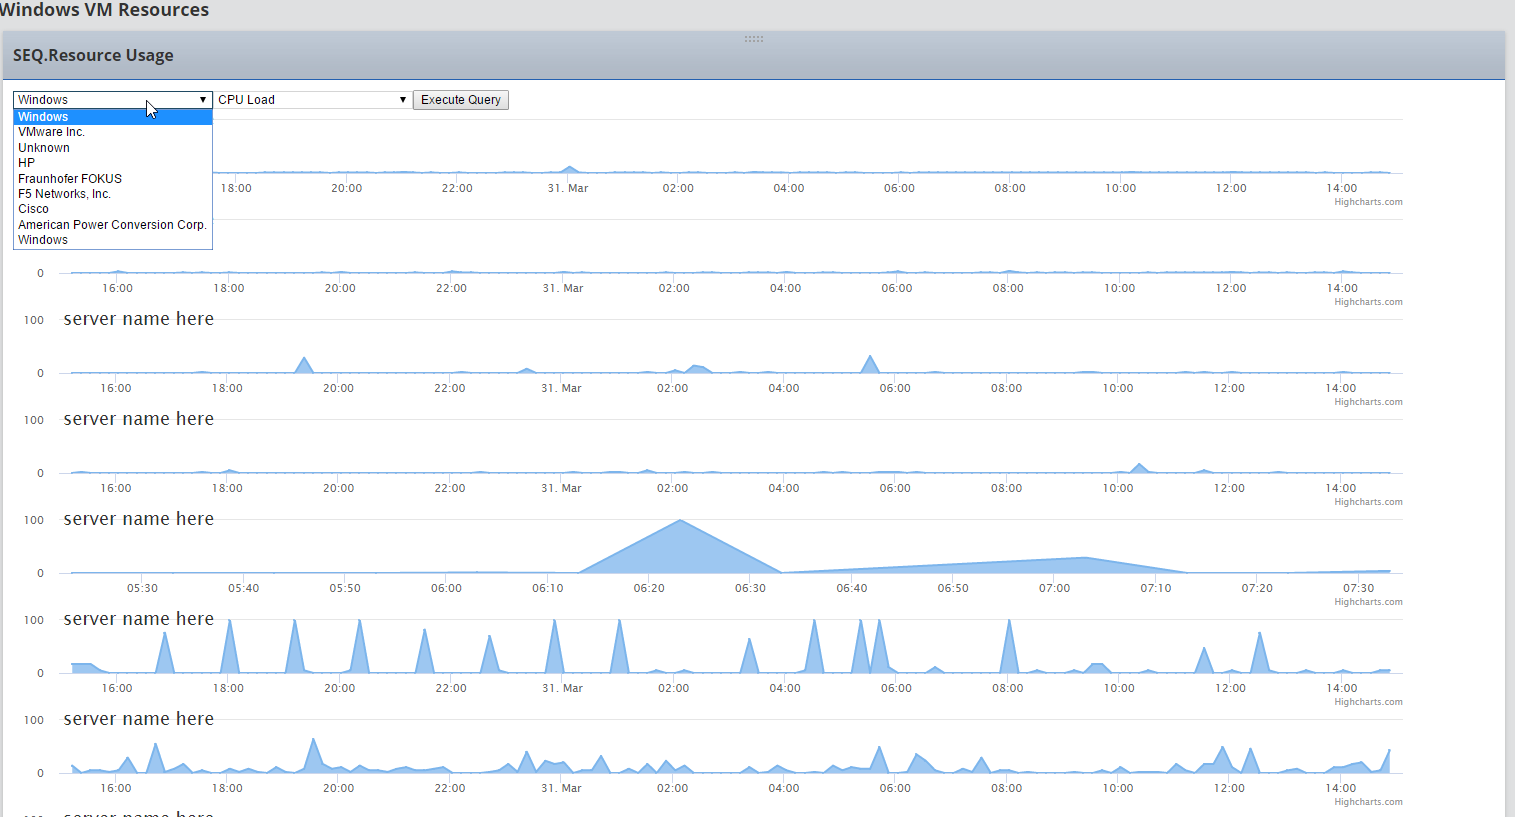
Here are a few example screenshots of the end results, and what your charts could look like.

ALL of the content, custom resources, and general know how, came from the mind and hands of
jnathlich12
I am simply sharing his work with Thwack Nation. (With his approval, of course)
This set of documents will break down the different parts of the resource, and explain (to the best of my abilities) what each piece is, and how each piece works.
With this page being the table of contents, so to speak, the next document (HERE) will explain how the resource retrieves, formats, and stores the data. The subsequent documents will explain how to display that data in different ways. While I could have just kept everything all on that same page, I felt the page would feel like too much information was crammed into too little space.
Here is a list of the other documents in this set:
1) The Query: Retrieving, Formatting, And Storing The Data
2) Simple Charts I: Graphing A Single Metric On A Single Element Over A Period Of Time
3) Simple Charts II: Graphing Two Metrics On A Single Element Over A Period Of Time
4) Simple Charts III: Graphing A Single Metric On Multiple Dynamic Elements Over A Period Of Time
5) Simple Charts IV: Graphing Two Metrics On Multiple Dynamic Elements Over A Period Of Time
6) Advanced Charts: Multiple Graphs With Various Metrics (Grouped) On Various Devices (Grouped)
Each document uses a slight variation of the same custom resource, allowing for different graphs to view data in different ways. The variations should be labeled on each of the pages, respectively.
I decided first document, "The Query", should have its own page, as it could live on its own, removing all references of highcharts from the code. (Basically, if you removed the entire highcharts section, "The Query" would simply gather data from the database, format the data into JSON format, and save the data to a file. You would simply have a file of the raw data, but not have any charts...)
While I will be attempting to keep these Thwack documents simple, going over only enough detail to show you how the main pieces work, jnathlich12 has provided an extremely detailed document, which I have attached below. So, if my words are just not making sense, or you feel I have skipped over something important, go ahead and download his document, and dive into the deep end.
Custom Resources, That Sounds Like Too Much Work, Right?
This mod is basic, but does require you to either run the config wizard, or delete the resource cache file and recycle the SolarWinds AppPool on the IIS server.
Basically, if you are able to read this, and you have "authorized" access to your SolarWinds server, then you should be able to easily add this modification to your system. (Okay, technically, you don't have to be authorized, but just don't go doing anything that will have the suits schedule you for a private tour of the quickest exit route off the premises...)
ESTIMATED TIME TO INSTALL/PERFORM MODIFICATION: <5 Minute
DIFFICULTY LEVEL:2-Padawan
- Youngling (Easiest/Most Basic; no coding experience required, no config wizard required, no system restart required, no system downtime.)
- Padawan (Easy/Basic; no coding experience required, possible config wizard required, possible system/services restart required, limited/no downtime.)
- Jedi Knight (Moderately Difficult/Advanced; coding experience is not required, but would be recommended, possible config wizard required, possible system/services restart required, limited/short duration downtime.)
- Jedi Master (Most Difficult/Advanced; advanced coding experience required, config wizard required, system/services restarts required, 30+ minutes downtime/maintenance window recommended, and other things that I do not even know I would need to know, required...)
This custom resource requires only the module(s) from which you want to collect and graph data. (i.e. If you only want to build a graph showing bandwidth usage on interfaces, then NPM should be sufficient. If you want to graph SAM data, then you would obviously need the SAM module.)
This mod does NOT require you to edit, replace, overwrite, or make any changes otherwise, to the default system files. (You will, however, be adding new files)
What Are The First Four Rules Of Customization Club?
Customization club is founded on the following four rules, which must always be followed before you may start customizing:
- Backup The Database, And Backup The Files
- Backup The Database, And Backup The Files
- Backup The Database, And Backup The Files
- Backup The Database, And Backup The Files
Has This Modification Been Tested?
These custom resources were installed, and tested, on various systems with the following SolarWinds product versions:
Orion Platform 2015.1.2, NCM 7.4, DPA 10.0.0, NPM 11.5.2, IVIM 2.1.0, SAM 6.2.2Orion Platform 2017.1, VNQM 4.2.4, SRM 6.3.0, IPAM 4.3.2, SAM 6.3.0, DPA 10.2.0, NCM 7.6, VIM 7.0.0, QoE 2.3, NetPath 1.1.0, NPM 12.1, NTA 4.2.2, UDT 3.2.4, WPM 2.2.1
Do I Need To Download/Install Anything Else To Make This Magic Work?
Other than having a functional installation of a SolarWinds product, you only need to download the following item(s):
Highcharts (Version 5.0.9 was used, however, you should be able to use a new version)
Where Do I Put Everything?
The following locations are simply the locations I used while testing this modification. Feel free to adjust things as needed to fit your environment/preferences.
Highcharts:
Extract To:
/inetpub/SolarWinds/Orion/js/highcharts/
(This is the custom resource file you will have created from these documents.)
Copy To:
/inetpub/SolarWinds/Orion/NetPerfMon/Resources/Misc/
How Do I Make My Newly Created Custom Resources Come To Life?
After you have copied your "CustomChart.ascx" file into the correct folder on your main SolarWinds server (web server), you will need to load the resource into the resource cache. This can be done one of the following two ways.
The Easy Way
1) On the main SolarWinds server (web server), navigate to the following folder:
\ProgramData\Solarwinds\Orion\
2) Delete the following file: (If you are uneasy about deleting files on your server, you can also rename it, as long as that filename does not exist in that folder)
WebResourceCache.xml
3) Open the IIS Manager, and navigate to the "Application Pools" section.
4) Select the "SolarWinds Orion Application Pool", and then click "Recycle", under the "Application Pool Tasks".
The next time you customize a page, and attempt to add your new resource (or any resource), SolarWinds will rebuild the "WebResourceCache.xml" file, and your new custom resource will magically appear.
("The Easy Way" has been brought to you by the following sponsor: antonis.athanasiou. Here is a link to his actual comment/process: https://thwack.solarwinds.com/docs/DOC-187082#comment-218477 )
The Hard Way
Okay, technically this way is actually hard. However, it will cause just a little bit of downtime, whereas the option listed above does not.
If you do not want to do things quick and easy, then you will need to run the config wizard on the web server, and rebuild things that way.
(While I am not 100% certain, I believe "The Hard Way" will only work on SolarWinds environments still running older versions. I think they changed some things after NPM 12, and the config wizard might just wipe all custom files out of SolarWinds folders... at least until you make a few adjustments, which will be posted elsewhere...)
Alright, Enough Of This Boring Information, And Silly Rules... Where Do I Go From Here?
(These are a "Work In Progress". Some of the links below may not yet be available, so please check back later.)
1) The Query: Retrieving, Formatting, And Storing The Data
2) Simple Charts I: Graphing A Single Metric On A Single Element Over A Period Of Time
3) Simple Charts II: Graphing Two Metrics On A Single Element Over A Period Of Time
4) Simple Charts III: Graphing A Single Metric On Multiple Dynamic Elements Over A Period Of Time
5) Simple Charts IV: Graphing Two Metrics On Multiple Dynamic Elements Over A Period Of Time
6) Advanced Charts: Multiple Graphs With Various Metrics (Grouped) On Various Devices (Grouped)