As a part of the Understanding Changes in EOC 2.0 series, I wanted to continue to provide details around customizing and enhancing views within the Enterprise Operations Console. Some of you may be looking to add resources to surface specific metrics critical to your organization. In the past, you may have leveraged the Global Top XX resources and created a dashboard to highlight information such as Global Nodes by Response Time or Global Interfaces by % Utilization. These canned resources are not currently available in the 2.0 release by default, but we are working on including this in a future release. For now, however, this functionality is not lost and similar views can be created by using a different method. In this post, I wanted to provide examples of how to create Top XX resources utilizing the Custom Table widget.
The first example will likely have the most amount of detail as we progress through the steps. After that, I expect you will have a good understanding of the steps necessary and I will simply provide example configurations. Lets start with Top Nodes by Response Time.
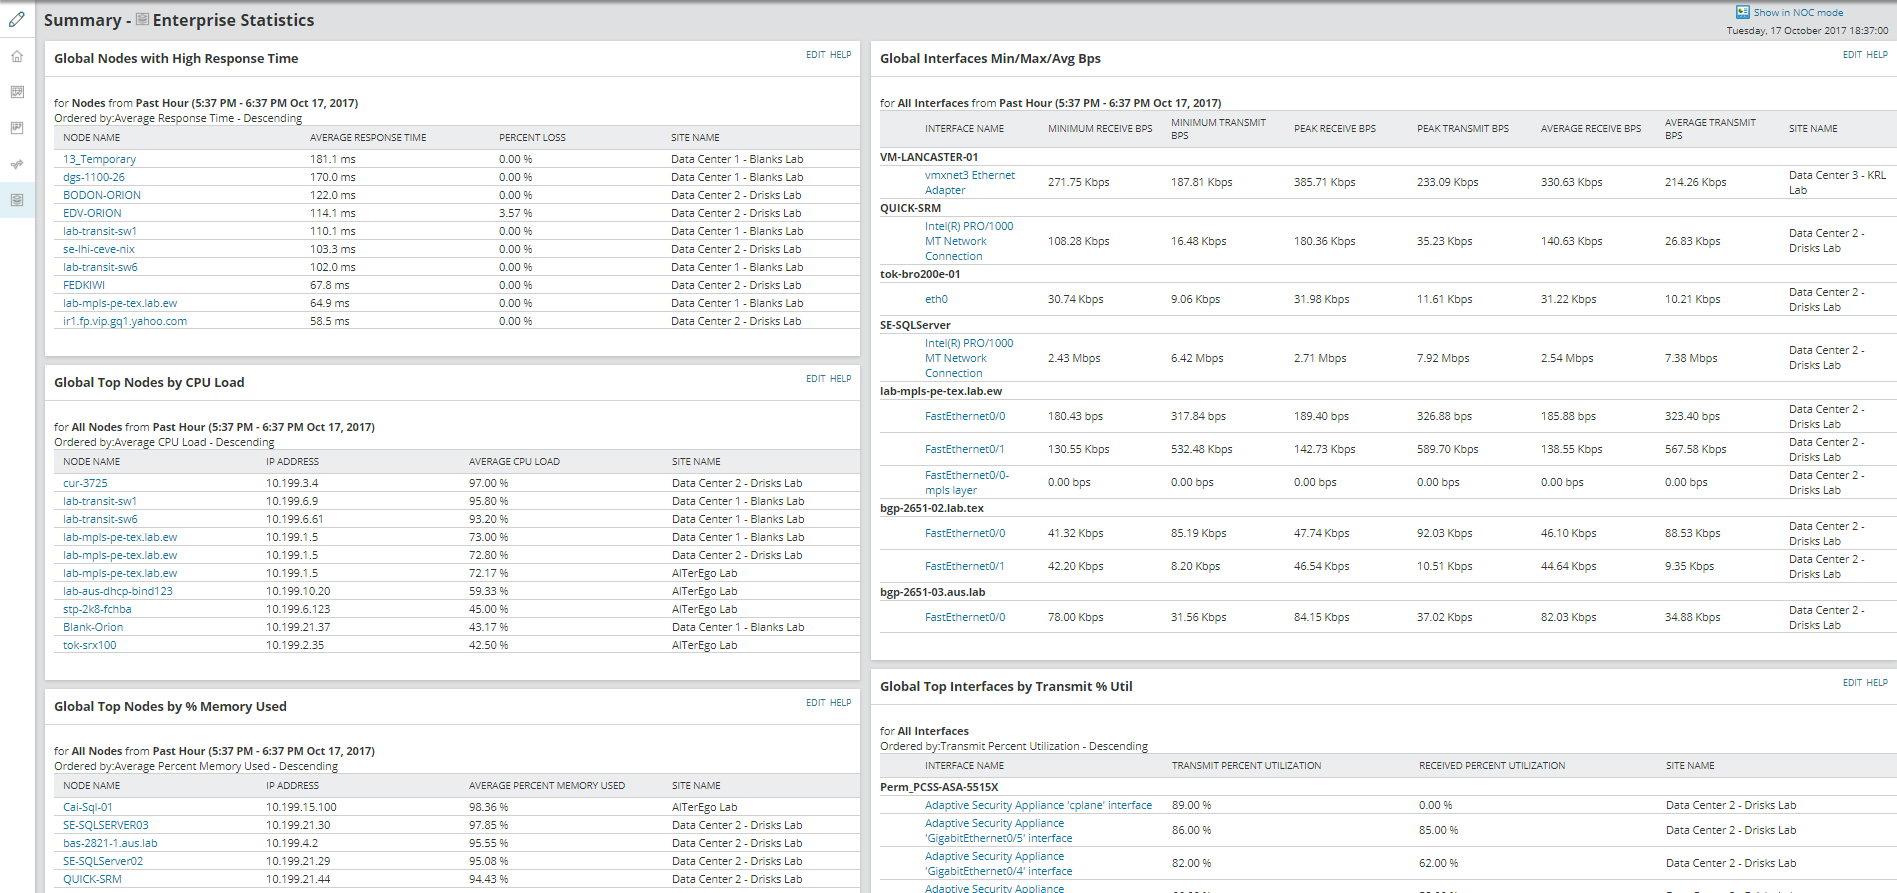
Global Top Nodes by High Response Time
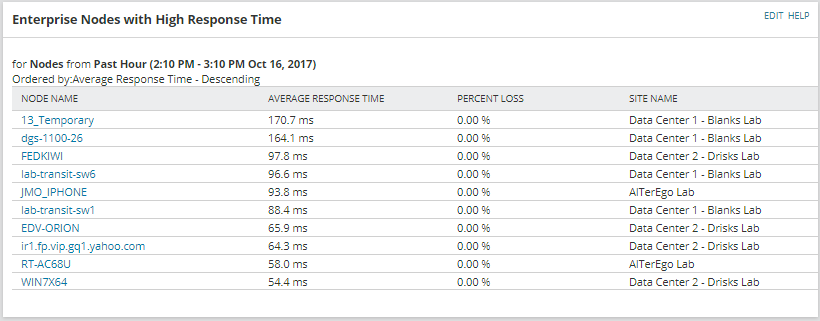
This is an example of Global Nodes by Current Response Time or Average Response Time. Lets walk through the specifics of how to create this resource. The first step would be to of course select the Custom Table from the Widget Drawer, and add this page to a view. Note: You will not be able to add resources to the Enterprise Summary View as discussed in previous posts of this series. This will need to be done on a standard summary view.

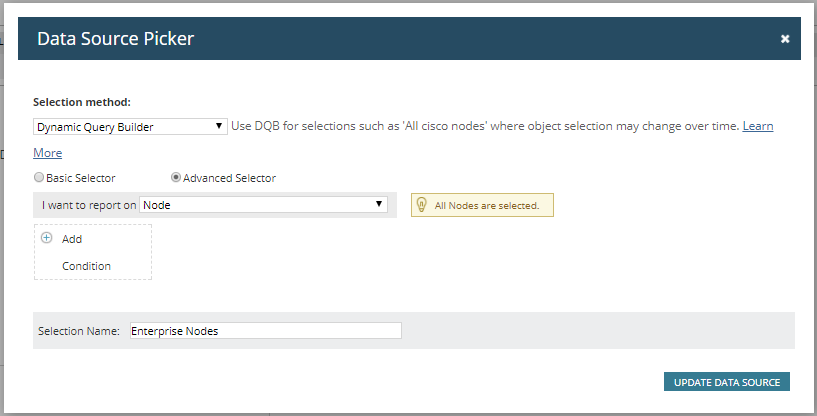
Once you click Configure This Resource, the first task that needs to be completed is to select the source we want our data to be sampled from. In other words, the Data Source. Since we are creating a Global Nodes resource to report across all our connected sites, this is very easy. Below is the Data Source Picker for this particular example. Pretty simple, just make sure the selection method is Dynamic Query Builder (set by default), and then choose Nodes with no additional properties. You can also give the Selection Name section something unique, other than Datasource 1, which is the default setting. When finished, select the Update Data Source button. | 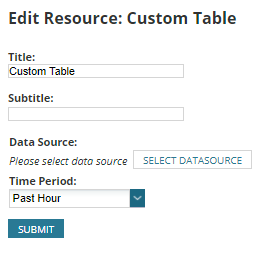 | | |
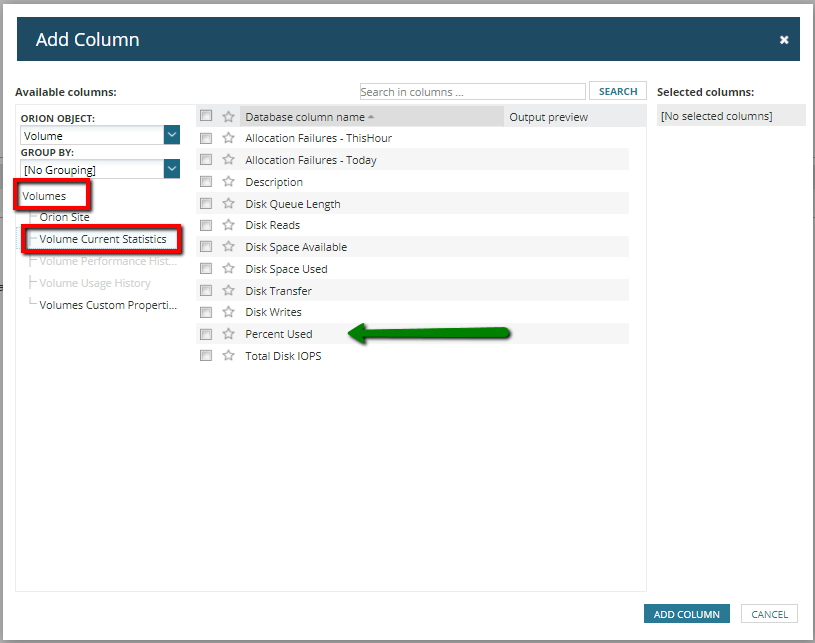
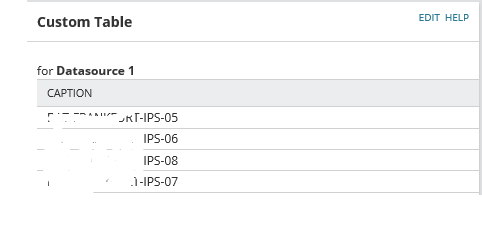
You will then need to add the columns for the table. Click Add Columns in the button under Table Layout. 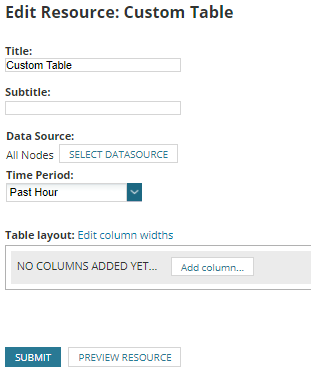
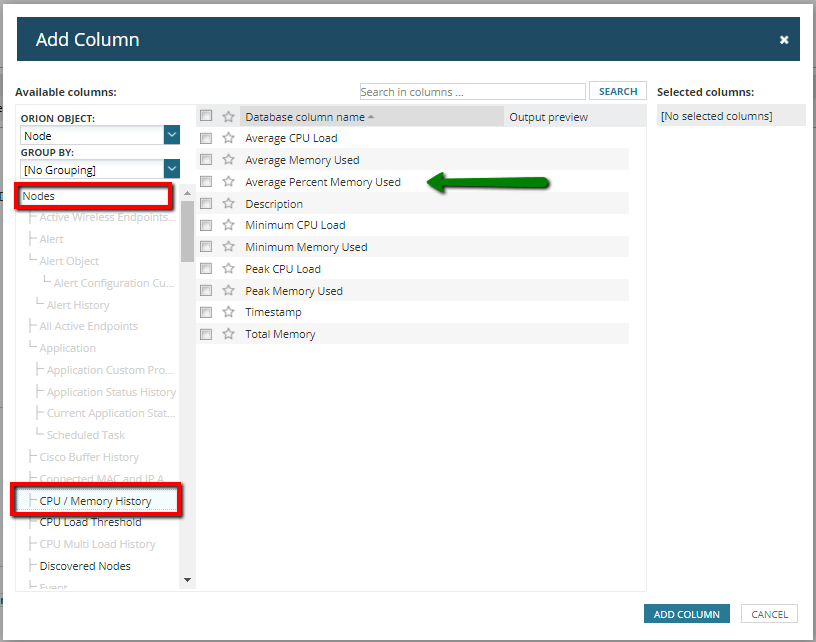
Then specify the columns; Node Name, Orion Site, Average Response Time, and Percent Loss. |  |
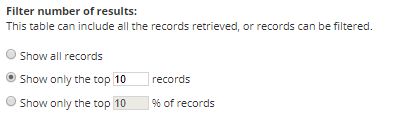
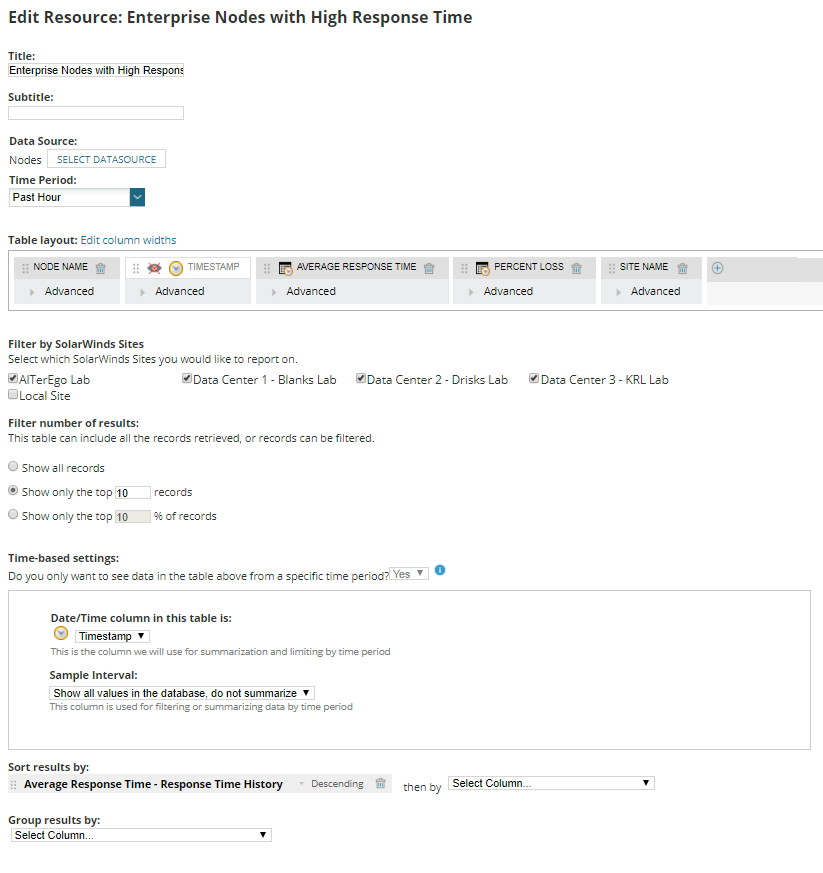
Clicking Add Column will then take you to the following page where you can adjust the column order, specify which sites you wish to see data from, select the amount of records to show, and the group by and sort by result options. Here is an example from my lab:
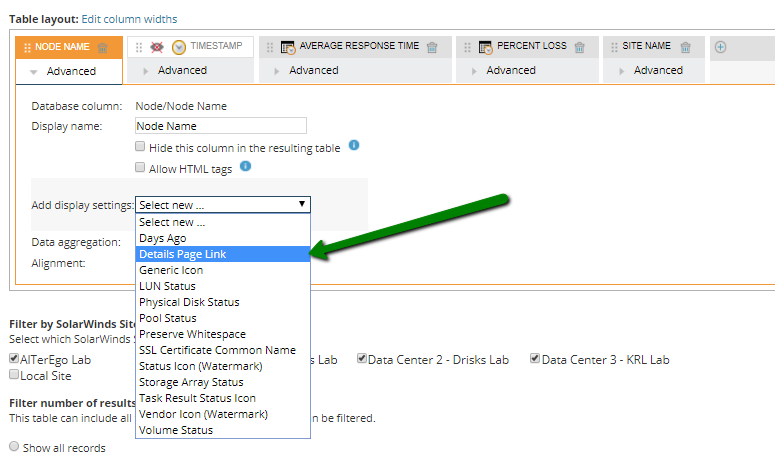
Here is a handy tip! Under Node Name, click the advanced options which will break out additional settings. Select Add Display Settings and Details Page Link, which will allow you to click on the node from the table and be taken to the Node Details Page
In the following examples, I will provide a breakout of the Data Source Picker and the Columns selected. For the following Node Top XX examples, you could certainly copy the resource and change the columns to save time.
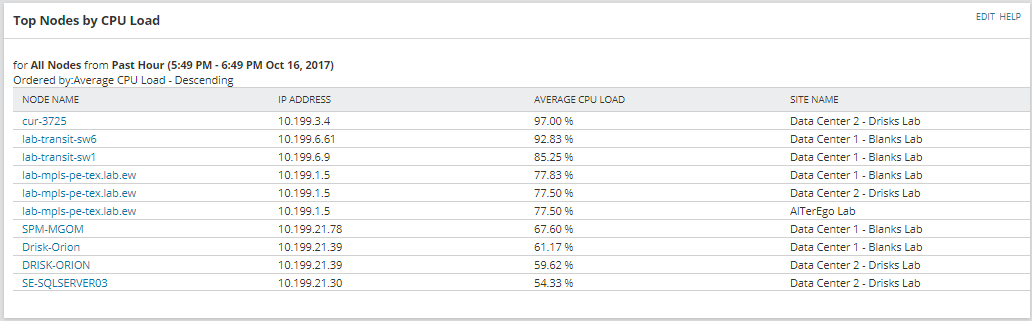
Global Top Nodes by CPU Load
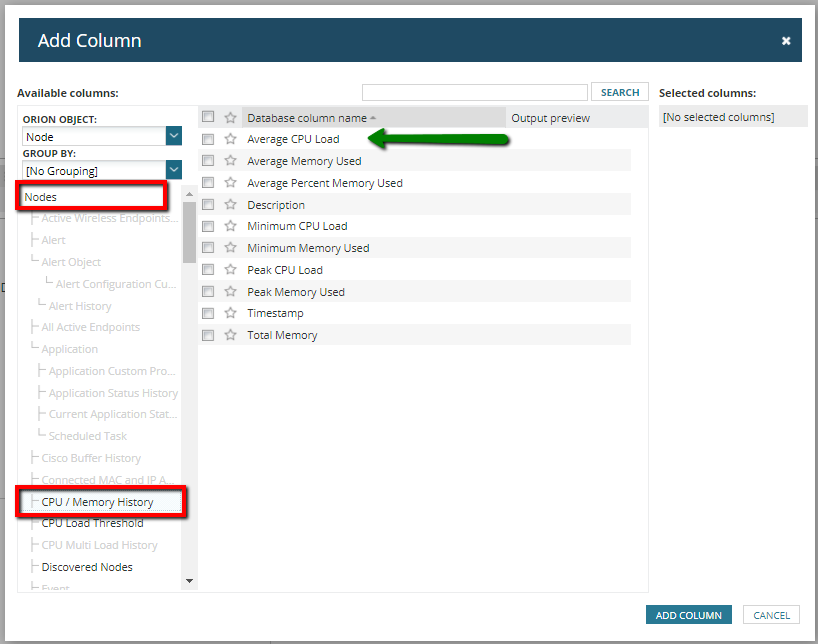
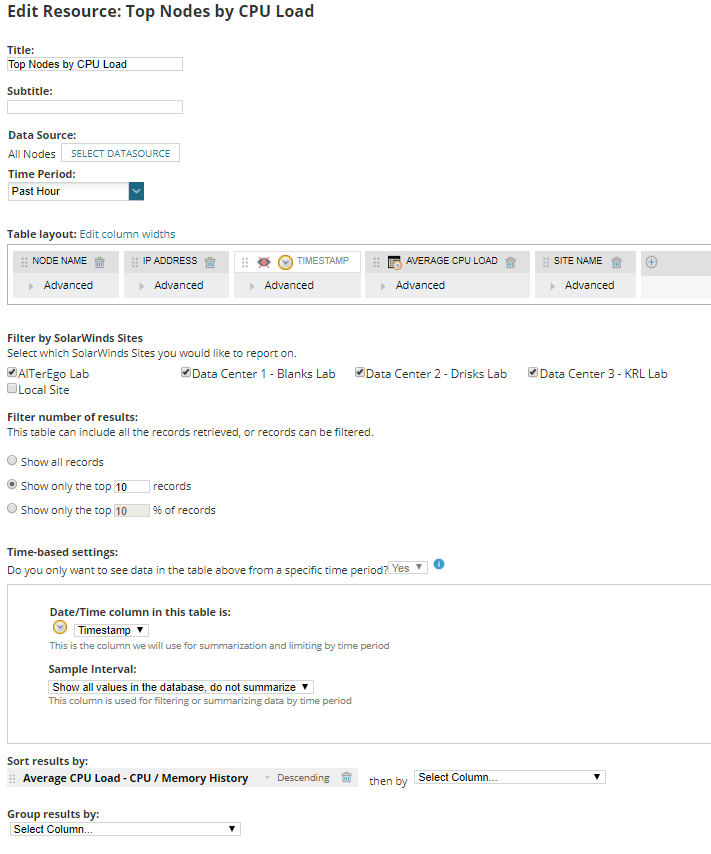
Below is a breakout of how to create a Top Nodes by CPU Load resource. I have provided the Data Source Picker, Columns, and Resource Configuration. Don't forget, under Node Name, click the advanced options which will break out additional settings. Select Add Display Settings and Details Page Link, which will allow you to click on the node from the table and be taken to the Node Details Page.
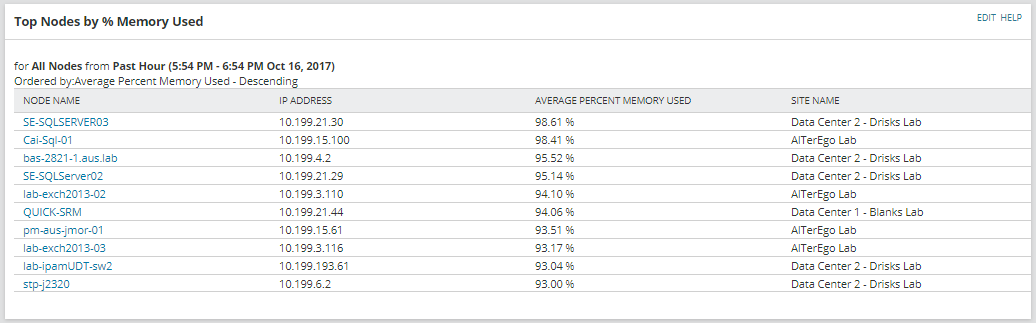
Global Top Nodes by % Memory Used.
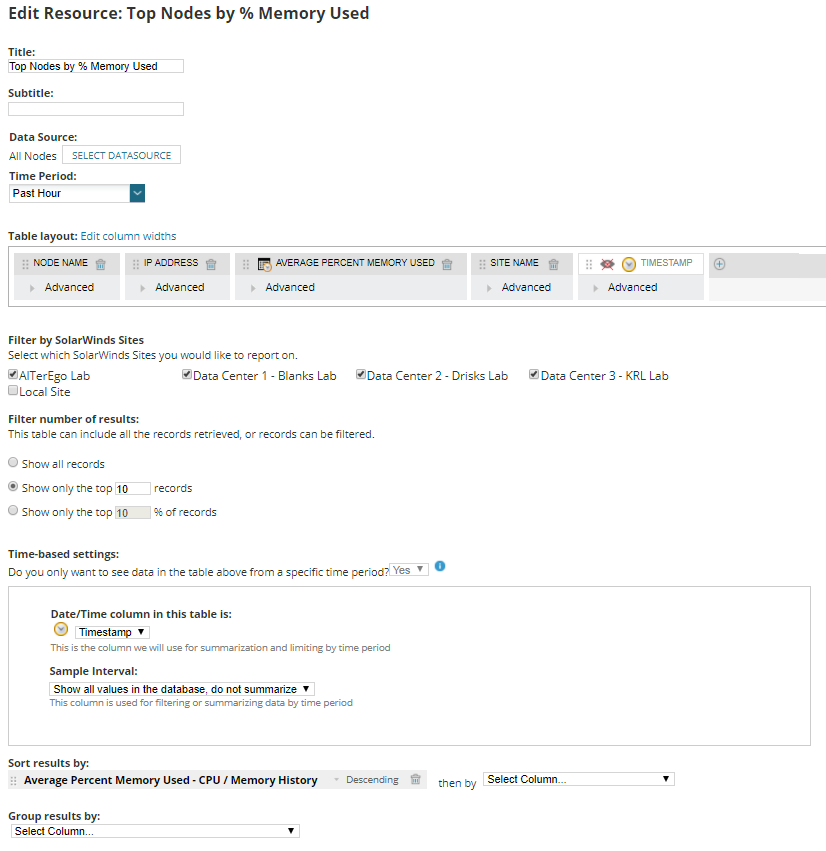
Below is a breakout of how to create a Top Nodes by % Memory Used resource. I have provided the Data Source Picker, Columns, and Resource Configuration. Don't forget, under Node Name, click the advanced options which will break out additional settings. Select Add Display Settings and Details Page Link, which will allow you to click on the node from the table and be taken to the Node Details Page.
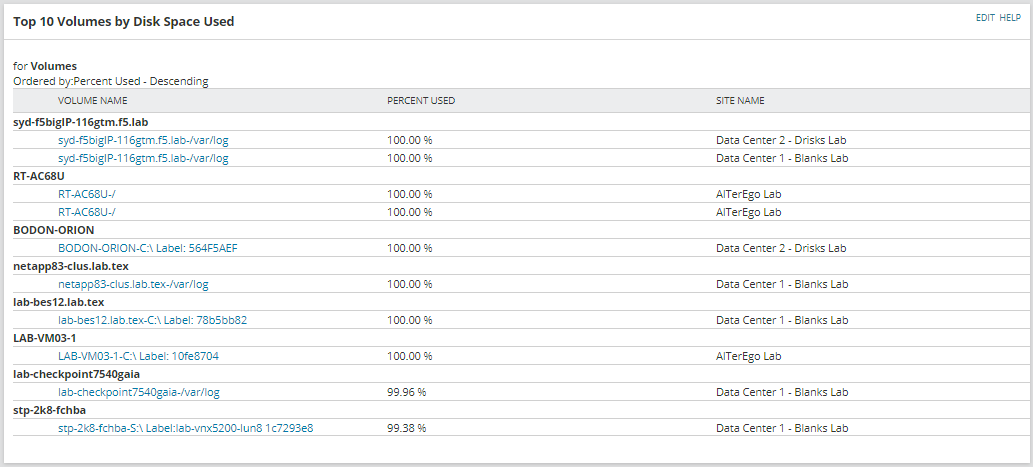
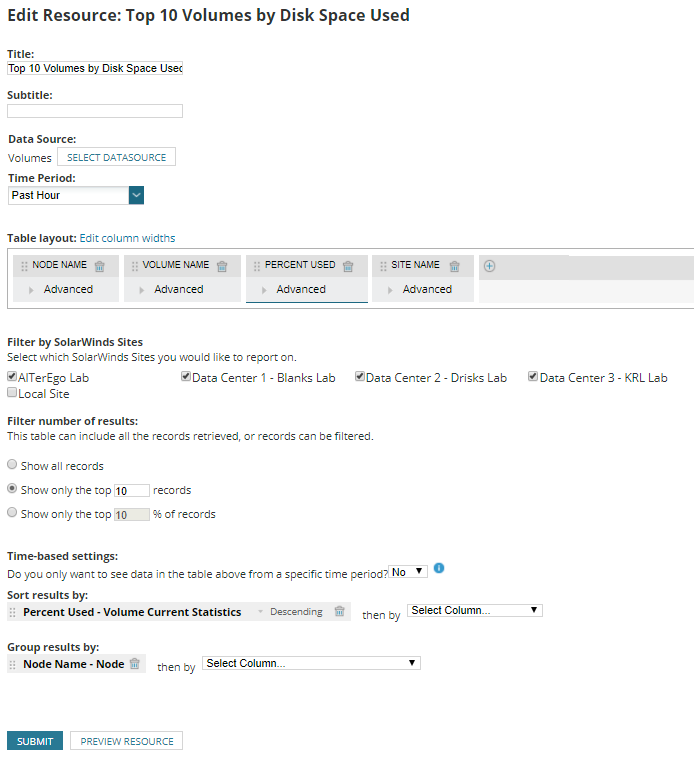
Global Top Volumes by % Disk Space Used
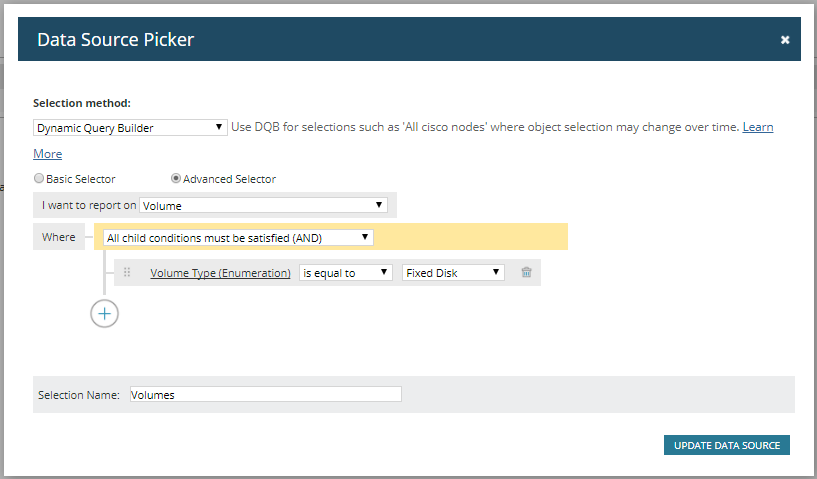
Here is another one that might be used often for creating a Top Volumes by % Disk Space Used resource. This would be slightly different from the previously examples, but the same concepts apply. I have provided the Data Source Picker (in which I focused me selection on "Fixed Disk" Volume Type), Columns, and Resource Configuration. Don't forget, under Volume Name, click the advanced options which will break out additional settings. Select Add Display Settings and Details Page Link, which will allow you to click on the volume from the table and be taken to the Volume Details Page. You may also want to change the Display Setting for format under Percent Used depending on preferences.
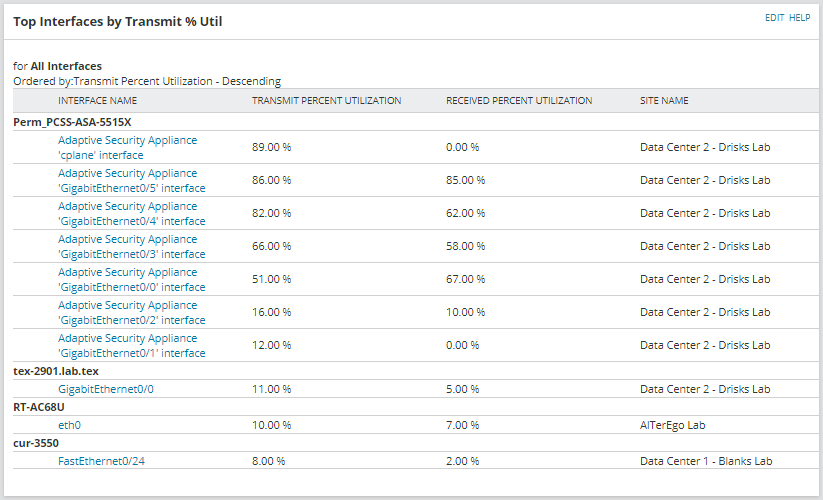
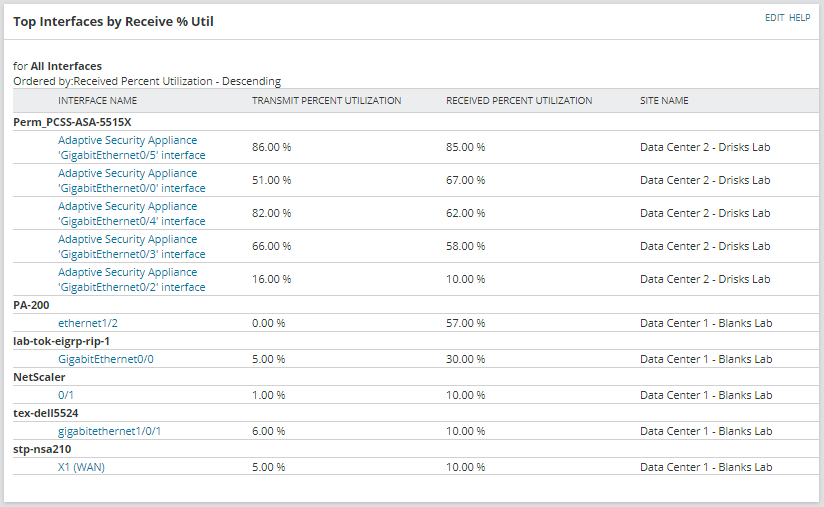
Global Top Interfaces by % Utilization
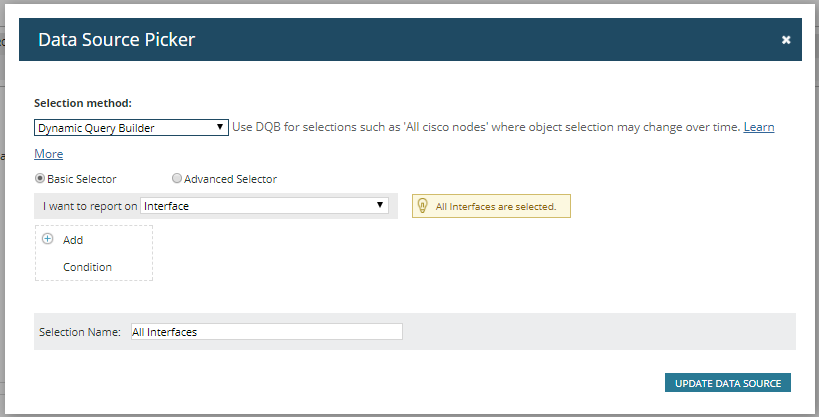
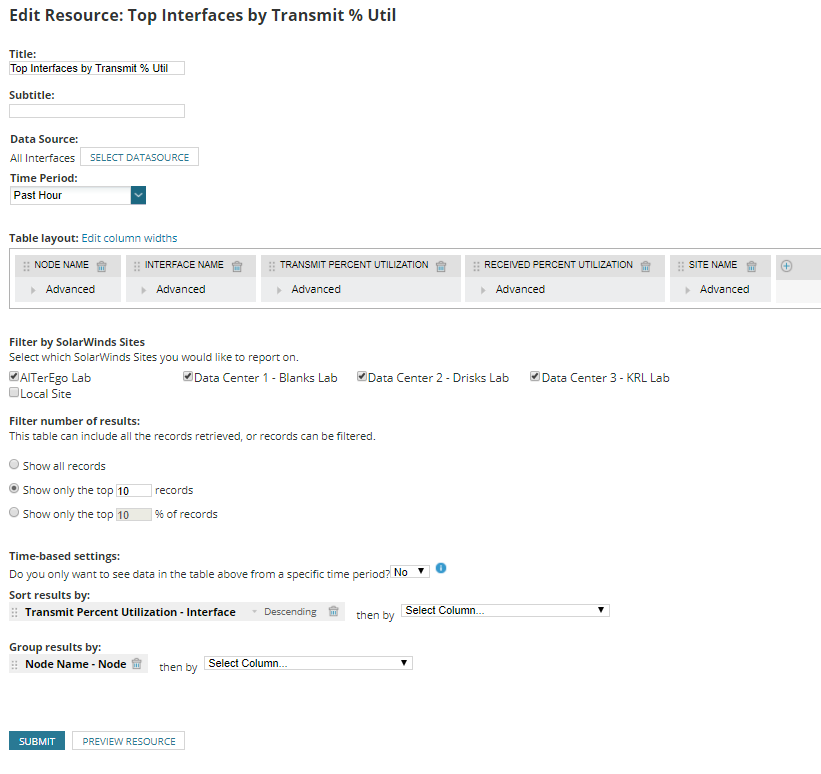
We can create interface based Top XX resources as well. I have some customization that I prefer in some of these scenarios and I will cover that here shortly. For now I will walk you through how to create a Top Interfaces by % Utilization resource. In the example screenshots below, I decided to provide a breakout of Transmit Utilization and Receive Utilization as one or both may be of similar value depending on your needs. I have provided the Data Source Picker, Columns, and Resource Configuration. Don't forget, under Interface Name, click the advanced options which will break out additional settings. Select Add Display Settings and Details Page Link, which will allow you to click on the node from the table and be taken to the Interface Details Page
 |  |
For the column selection, the majority of what you need is under the default Interfaces section such as Interface Name, Received Percent Utilization, and Transmit Percent Utilization. If you wish to have the Node Name included, you will need to toggle the Orion Object section to Node and select Node Name as well. Of course don't forget to include Orion Site. Below is the resource configuration of my example. | 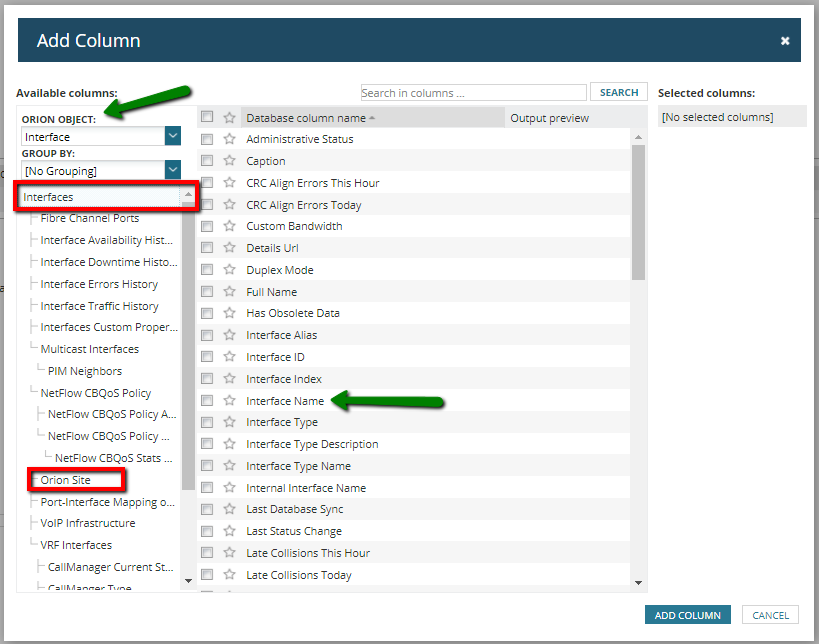 |
Custom Dashboards & Custom Charts
Using the concepts described above, you can create a similar resource for Top Interfaces by Traffic, or any other critical data you are looking to highlight. For example, I also created a resource in which I wanted to see a Min/Max/Avg bps resource and added it to the completed dashboard that I incorporated into a NOC View.
Now unfortunately these resources may not have the linear gauge, which I agree adds some visual appeal to the dashboard. Aesthetics can be just as important as the data we are looking for and certainly important to SolarWinds as well. In many cases this can draw a users eye to potential problems quickly, and that is a major part of what we are after. Here is an example of what I am referring too: | 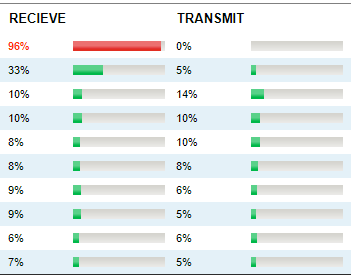 |
There is however options in EOC 2.0 that you can take advantage of that were not available in previous versions. Custom Charts can be coupled with Custom Tables to provide the same visual aid to highlighting areas of concern. Below is an example view of a dashboard I created for specific, critical interfaces, across my distributed instances.
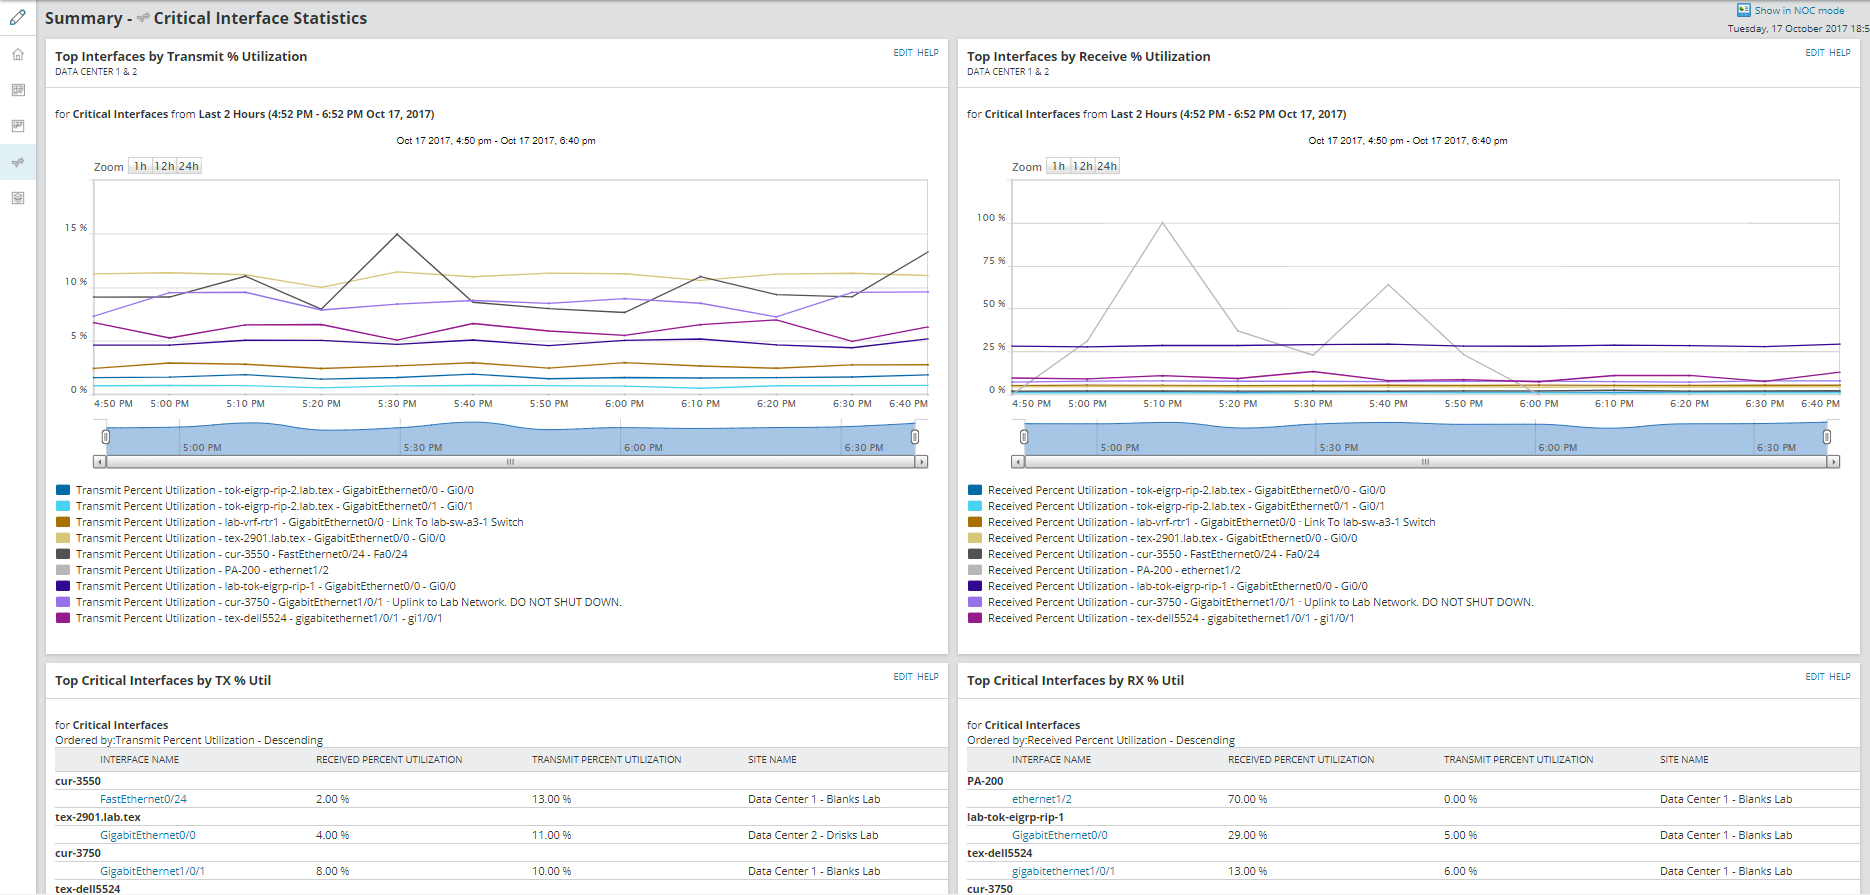
In this example my goal was to have a dashboard that only highlighted data for interfaces across my environments that I deemed "Critical". At each of the distributed instances, I use custom properties often and this comes in handy when customizing views, reports, or creating alerts. The process for creating a chart is very similar to a table, so here is the example of the Data Source from a custom chart.
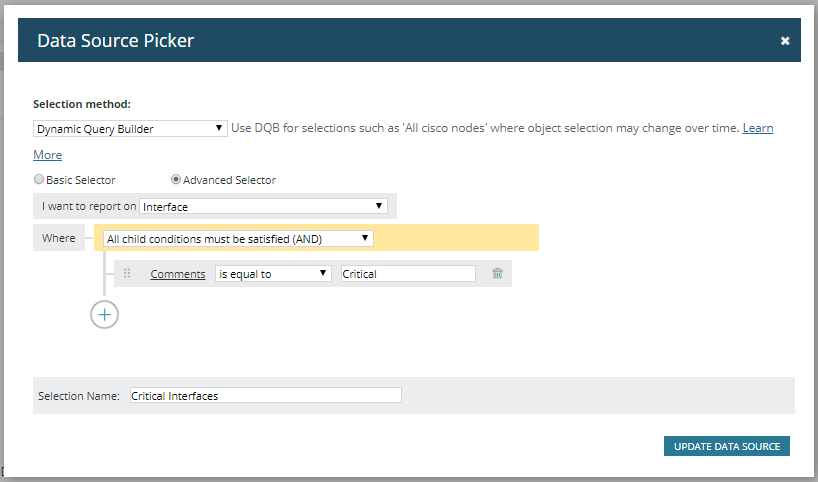
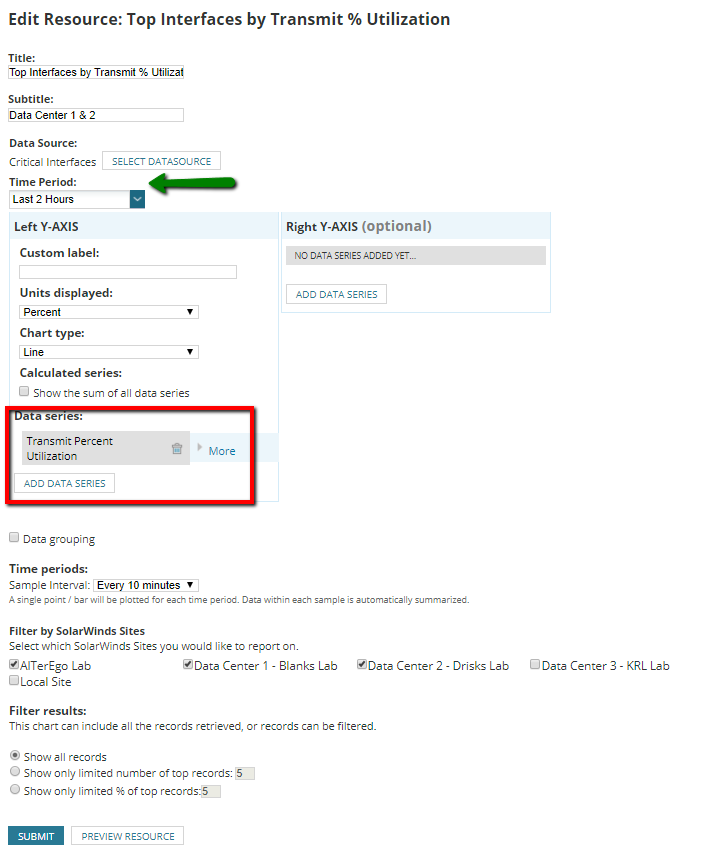
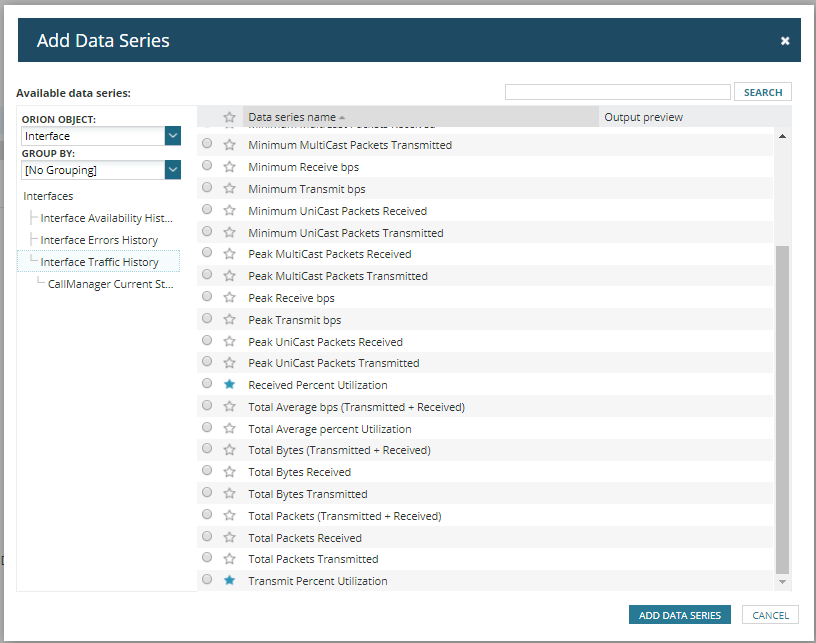
Now you will notice throughout the examples I provided in this post that the Time Period has typically been set to a smaller window. As a reminder, EOC leverages federated SWIS to run queries on demand and report on that data. More complex queries, and more historical data could impact performance, and I would suggest reports if you needed to see significant historical details. In a table, we would add columns. In the chart we select the data series we wish to view. Again, I chose to separate Transmit and Receive Utilization in this case. I included the configuration of the resource and the data series selection below. Note: I didn't have as many of the "Critical" interfaces in my environment so chose to show all records where you may want to limit the number of records for your view.
 |  |
As always, I hope this post helps to provide some valuable customization tips for those of you that may be looking for creating views similar to what you had in versions prior to the 2.0 release. As always, we are working diligently to improve our products and want to provide the functionality that you need. You can view the EOC - What We Are Working On - SEP 2017 post to see what is on the horizon, and I welcome thoughts on improvements you would like to see in the future releases. Stay tuned for more posts in this series.
NEW
Enterprise Operations Console 2.1 Now Available!