Greetings -
So I have a boring old report that generates uptime data for our network infrastructure equipment. I created one base report and then modified it and created three different reports - 12 month uptime, Current Month uptime, and last month uptime.
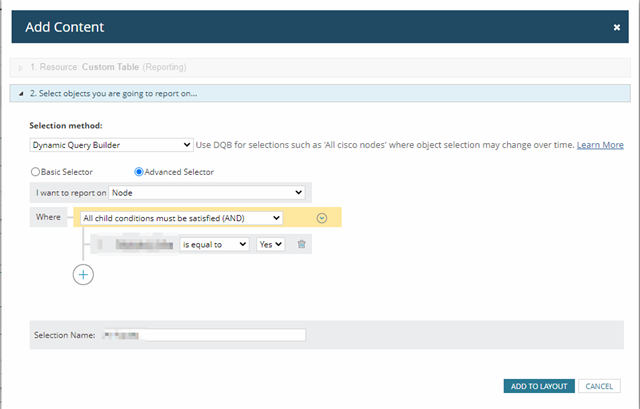
Current report is designed to be easy to modify and change. I used the dynamic query builder with a custom property for each locations network equipment and the report generates off the data from last month.
I was asked if there are any other ways to present this data. I am thinking I could do something with Modern Dashboards or maybe something with more bright shiny objects.. Looking and open to suggestions. Thanks!