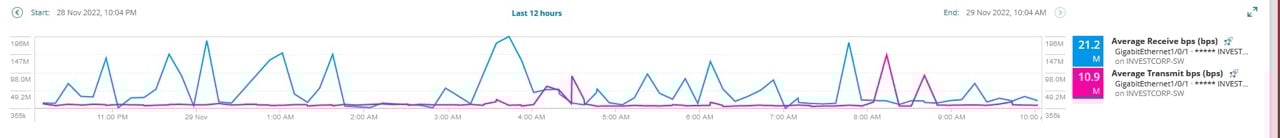
Can you please guide us where we can get the attached table for customer usage that represent the below graph.
I believe the data for this graph will be in Orion.NPM.InterfaceTraffic entity, accessible via Solarwinds API. You can check with SWQL Studio too.
Google Solarwinds Orion SDK and you will find information about the API. The stats you are looking for are available to query from an external tool if you need to.
Are there any APIs by which we can show this graph on the external system ? If yes then can you please send me the URL ?
This is a screenshot from Perfstack. You can learn more here support.solarwinds.com/.../SolarWinds-Performance-Analysis-PerfStack
PALO-ALG - Logging.xmlPalo Alto Networks ALG Security Technical Implementation Guide :: Version 2, Release: 3 Benchmark Date: 27 Oct 2022
Alert Cleared.htmlHello, I would like to share the HTML template details we have prepared so that Solarwinds alarms can become more meaningful. It can list alarm object details and connected device details separately in HTML template. Except for object and device details, you can easily add custom property information…
Cisco ASR Devices.pollerCisco ASR Devices
SWQL is built on the framework of SQL and as such supports most of the standard clauses as part of a query. A very simple example query is: SELECT Caption, IPAddress, Vendor, ResponseTime FROM Orion.Nodes Dissecting this query is relatively straightforward: show some fields (Caption, IP address, Vendor, and Response Time)…