Over the years I've really tried to standardize on good alert hygiene. Decrease the number of alerts in my environment and really try and understand who and what is being noisy. I'm sharing this report that I built which gave me the data I needed to not only decrease alert noise but also make sure I'm following best practices for alerting.
It is no doubt that there are a lot of numbers involved when looking at an alert. On the front there are numbers like: Count of nodes associated with an alert, metric values set to particular thresholds, delays in how long a threshold has to be surpassed before an alert triggers, just to name the easy ones. On the back there are other important numbers to consider like: How many times has this alert triggered, how many times has a particular node triggered this alert, what is the polling interval for each of the metrics in question, and so on.
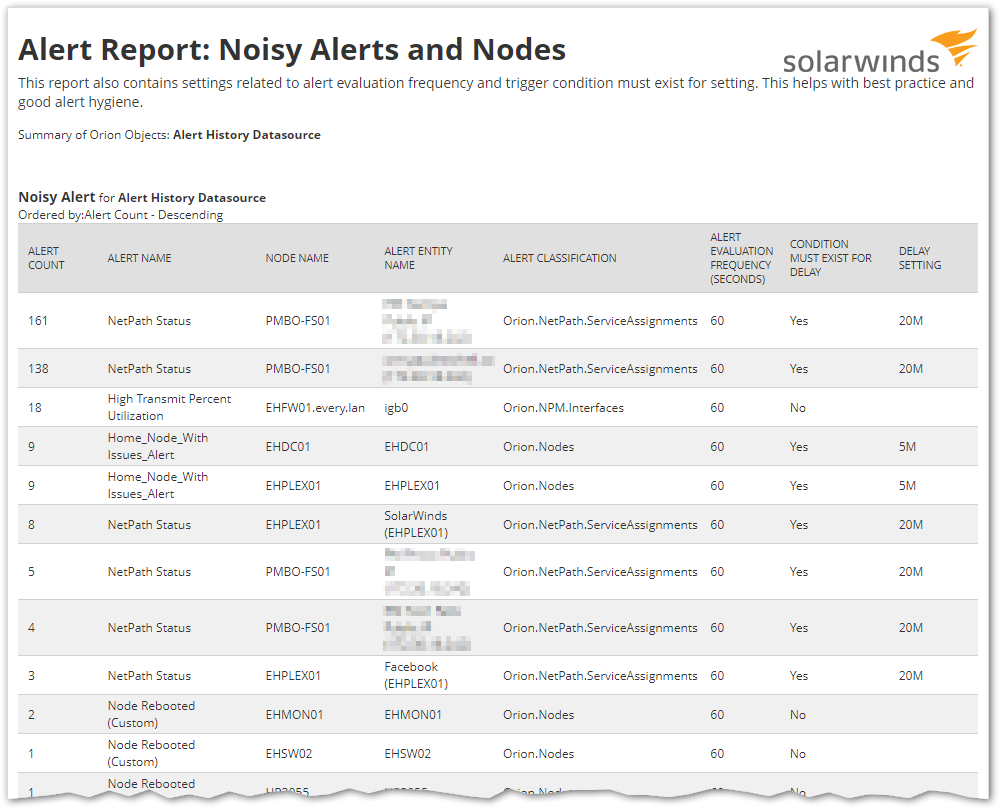
It can be an overwhelming task to find the right settings for all of these. This report gets your foot in the door to know how things are configured. The report shows you what alerts have triggered the most and what nodes are affecting that count the most.
Another important note is I've included both the frequency the alert checks (Alert Evaluation) and if there is a delay on when the alert is triggered, called 'Condition must exist for'. I've walked into other deployments of SolarWinds where the 'Condition must exist for' setting was set to 5 minutes. However, the alert was for interface utilization and the default interface polling interval was set to 9 minutes. So the 5m delay did not account for 2x polling cycles. It merely delayed the alert for 5 minutes. Getting these delays inline with your polling intervals is crucial to effective alerts. Finding this number had always been a manual task of editing every single alert and looking, which, basically means no one ever did it. This report will show what that setting is for easy reference. The format of the setting is not an interval but a string, but its format is easily readable. e.g. 10M = 10 Minutes, 1H20M = 1 Hour 20 Minutes.
Hope the report is helpful and happy monitoring!
This report can be downloaded here:
Understanding which alerts and nodes are the noisiest and general alert config best practice - Reports - The Orion Platform - THWACK (solarwinds.com)