I have seen some similar posts but I can't seem to find an answer. On my AppInsight monitor page, I have this widget:
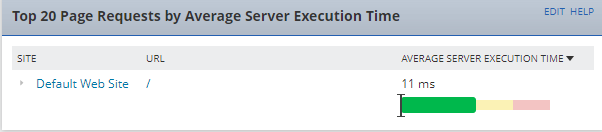
I would like to create a report that shows this for all of my IIS installations. I cannot for the life of me find it in the reporting. I can't find a stock report for it and I cannot find anything resembling "Page Requests by Avg Sever Execution Time" in the column list for a custom table either. The information has to be somewhere. Does anyone know where I can find it?