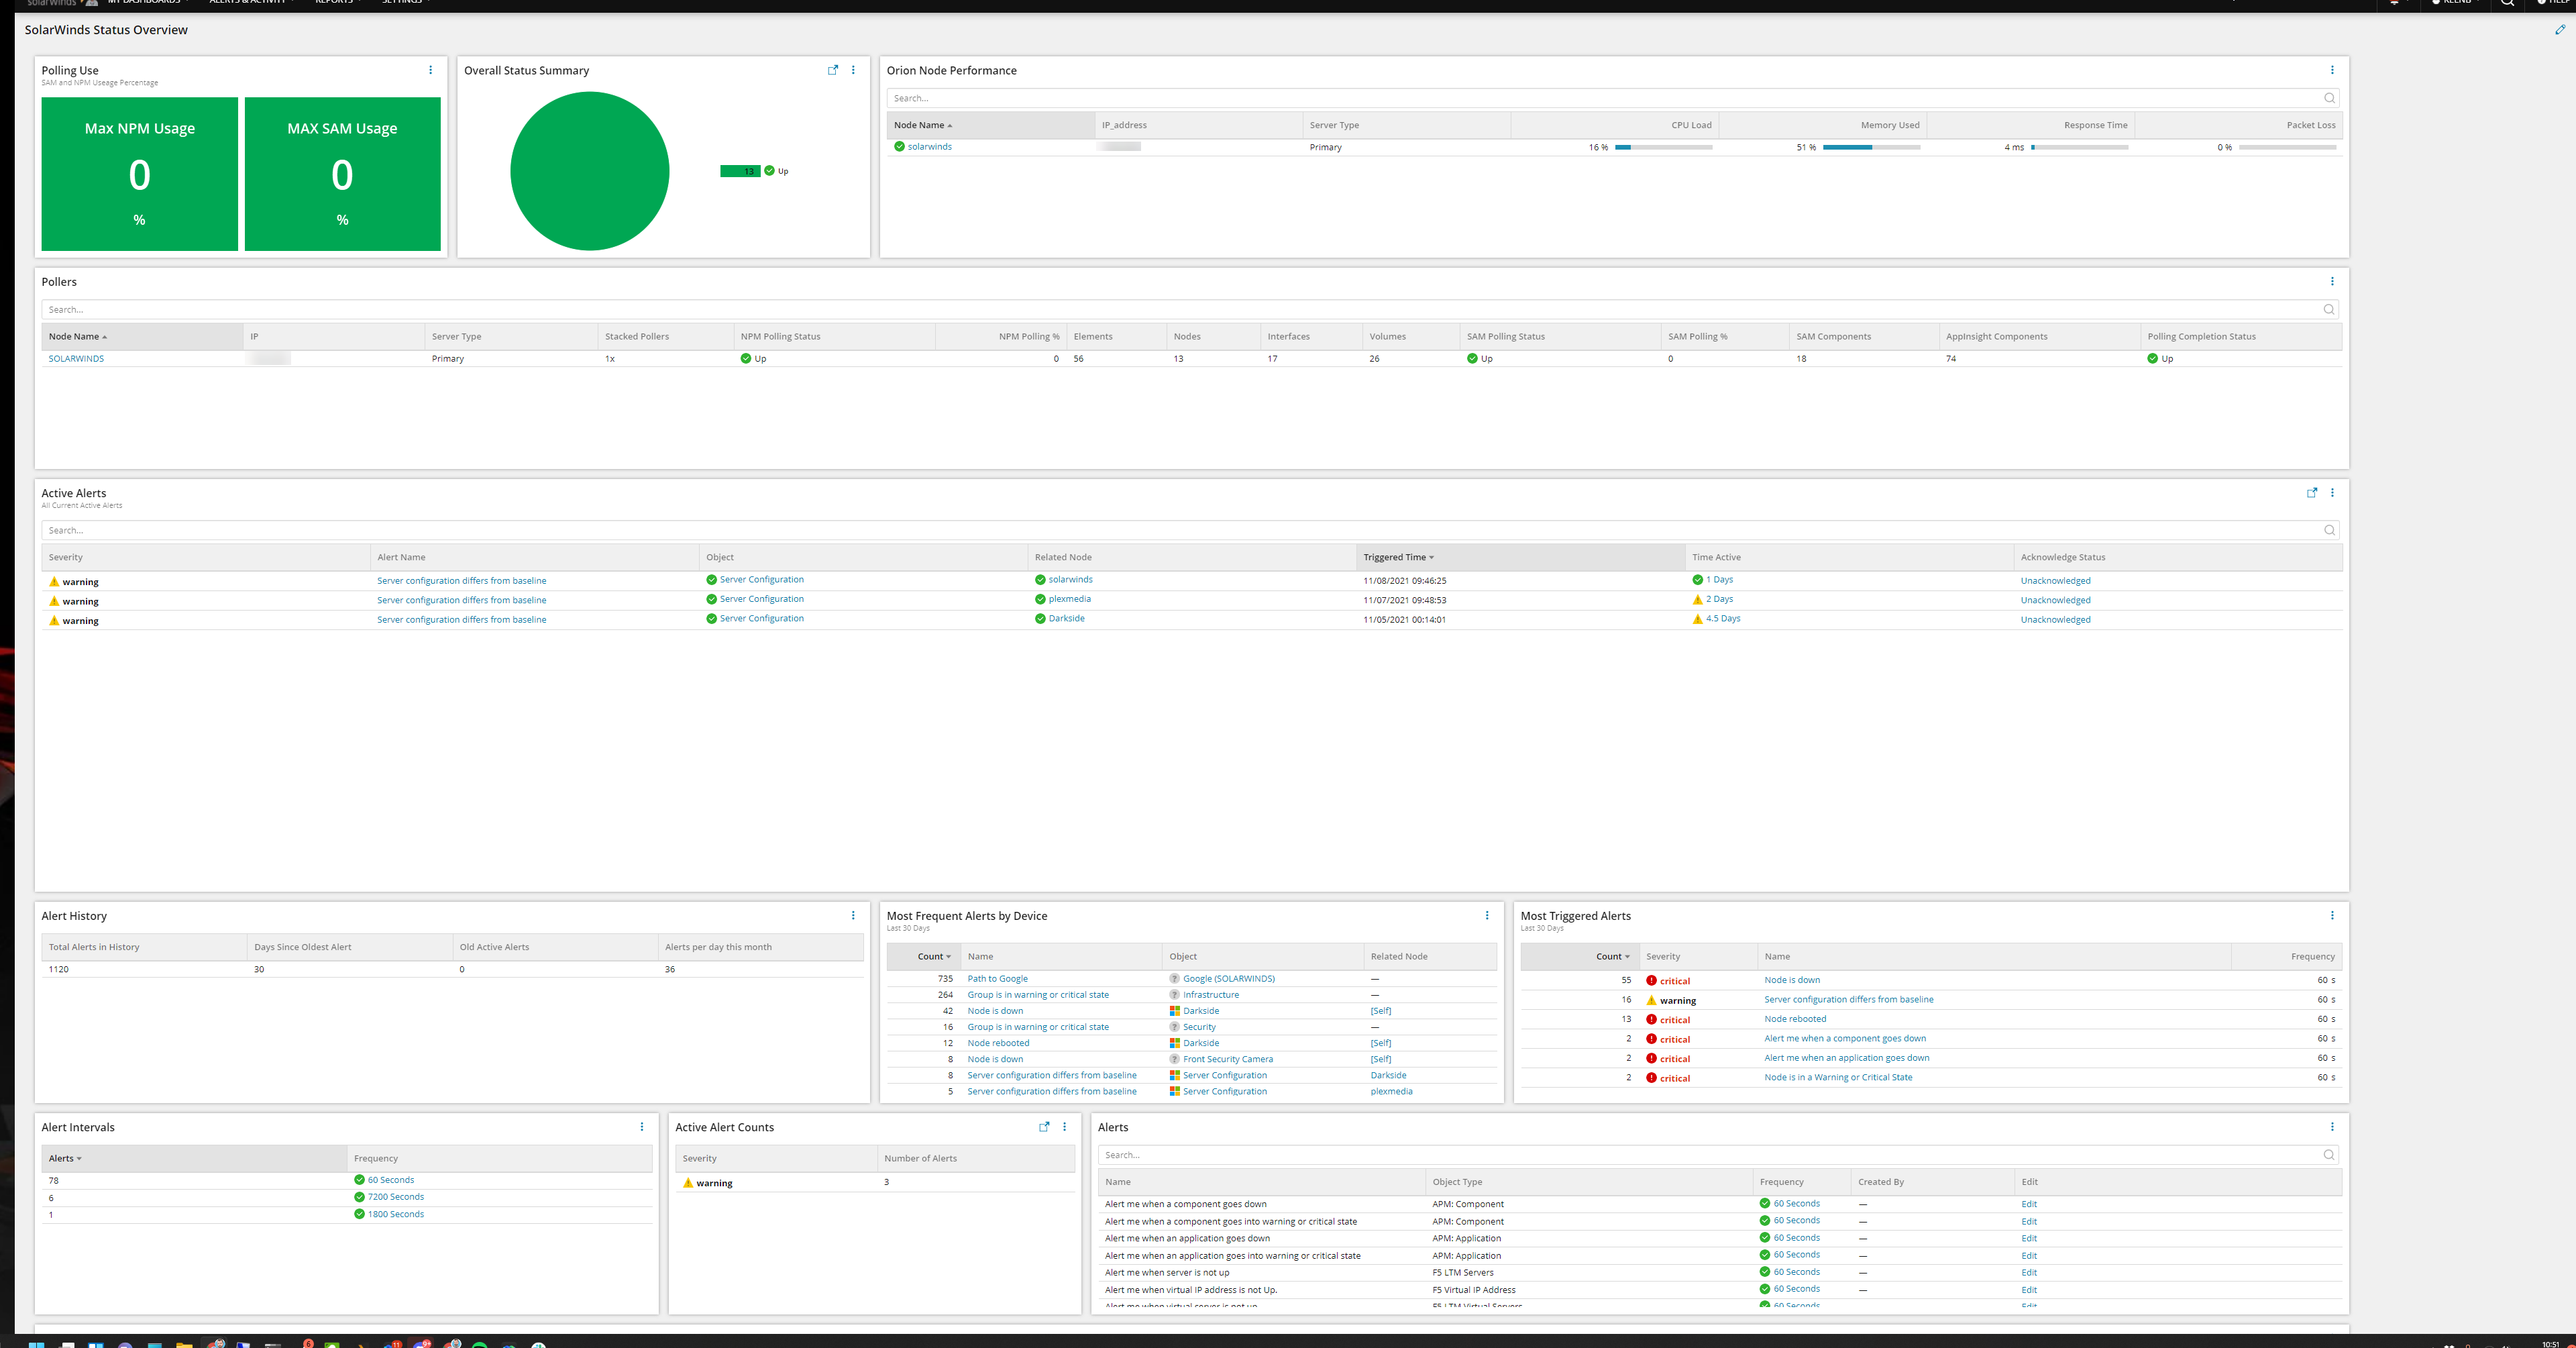
With the introduction of Modern Dashboards in the Orion 2020.2 release, I've taken a lot of time to start leveraging them more within my environment. Personally, I feel the presentation is a lot eye-pleasing and just gives SolarWinds a more polished look.
This dashboard is simply just the "modernizing" of the Classic SolarWinds Admin Dashboard. The dashboard features widgets that will give you the following details:
- Overall Environment Summary
- Highest NPM/SAM Usage Percentage
- Poller Information Status and Performance details
- Quick Credential Lookup
- Polling details
- Alert History and Details
- Nodes/Volumes/Interfaces with Polling issues details
- Polling Intervals
- Quick Custom Threshold Lookup
I recommend that your system is on Orion 2020.2.6 or higher for all the widgets to display the correct icons. You can download the JSON file and import this dashboard directly to your environment by visiting the new Modern Dashboard Content Exchange.
Please feel free to reach out with any questions or ideas for improvment!
!!UPDATE!!
Verison 2.0 of the SolarWinds Admin Dashboard is now available on the Modern Dashboard Content Exchange. The update includes a new layout and new widgets showcasing information on the alerts and allows you to acknowledge the alert via the widget and track which user acknowledged the alert and when.