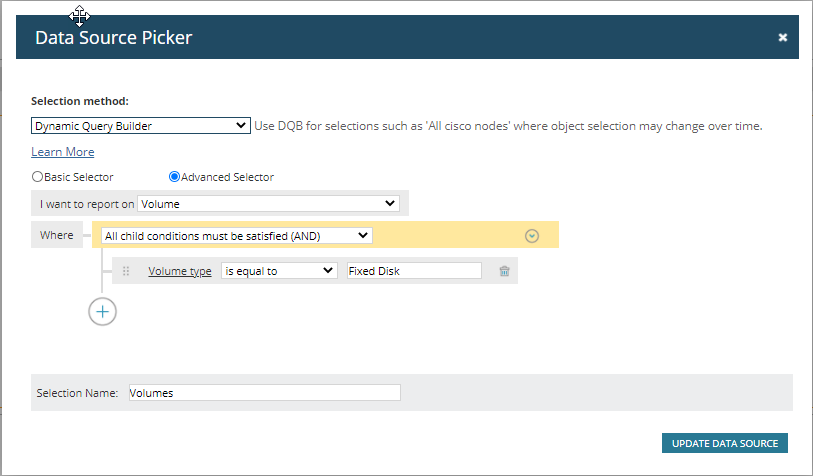
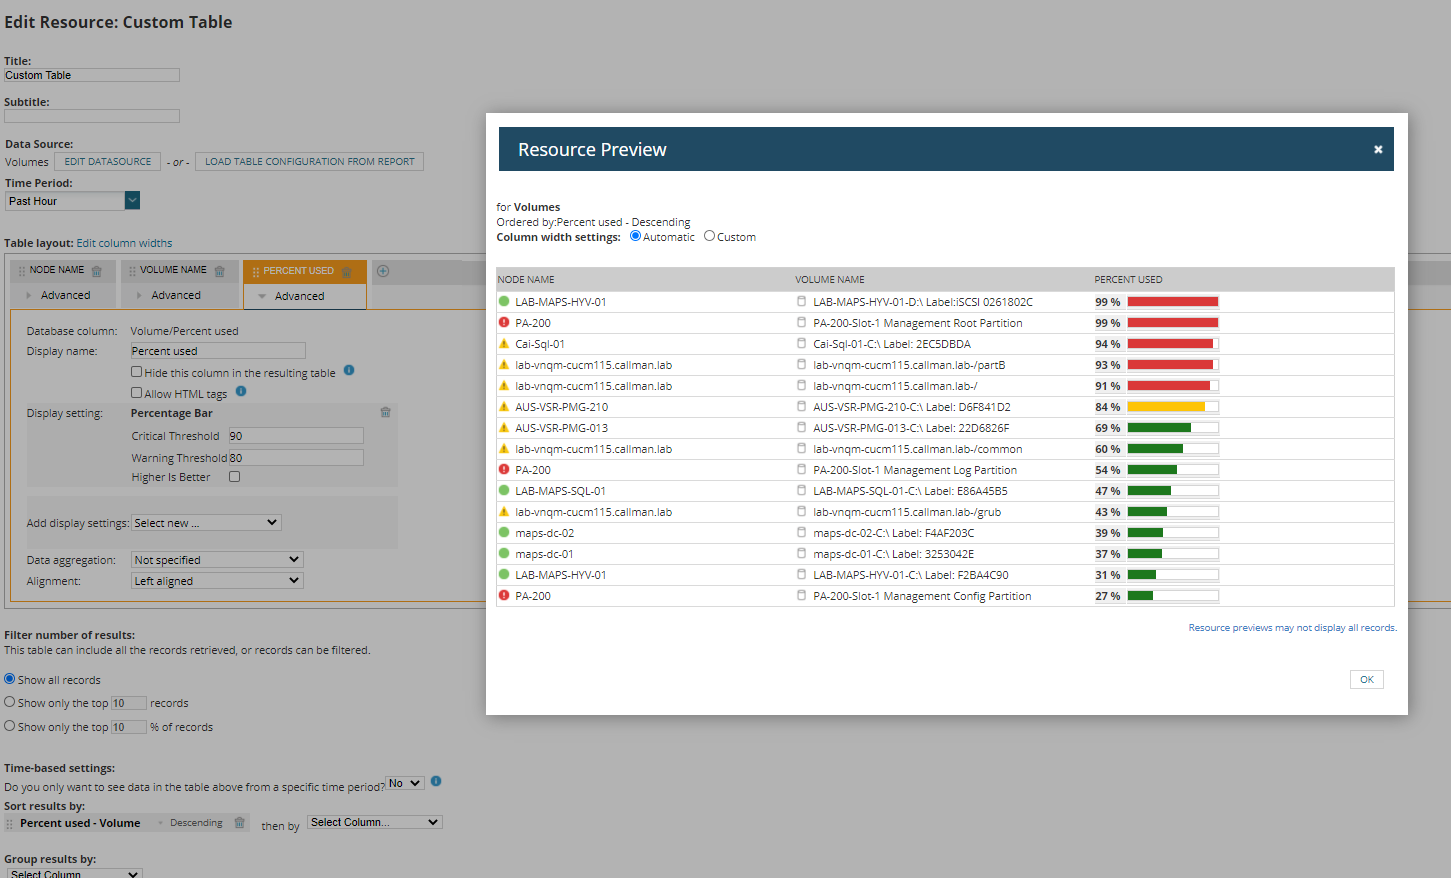
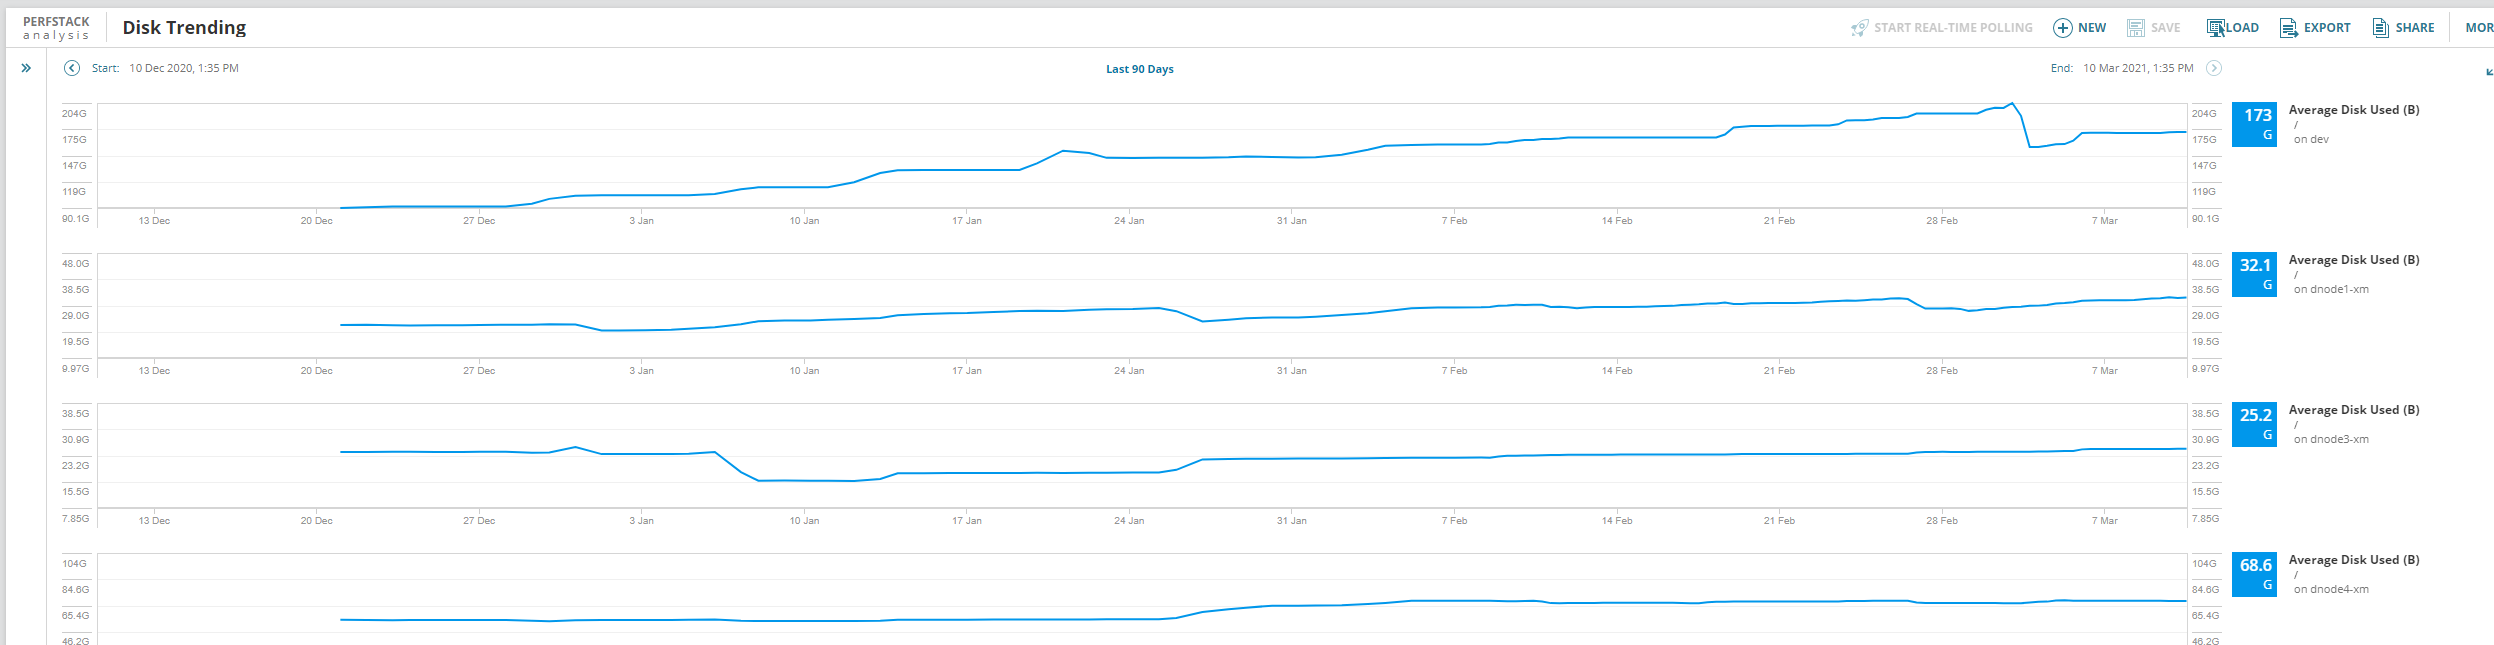
I have been tasked to create a "dashboard" of all of our server volumes space trending. I figured that Perfstack would be the best place to build the report. I went into PerfStack and selected the Volumes option. It looks like it only allows you to add one check box at a time rather than having a Select All button. That was the first problem. The second was once I selected a volume, I wanted to show the Average Disk Space for each volume I had selected in order. It appears that instead of being able to select a metric and then add the volumes to the list so the metric for each is displayed, I have to select a volume, then drag the Average space used widget to the display area. I have over 250 volumes I need to show so trying to do this one by one would be a very time intensive task.
Is there a way to create this report/dashboard/view in PerfStack that would meet my requirements but not take several hours to build?