I have interfaces that keep showing up as 2100% utilization and the custom bandwidth box is not checked. What could be causing it to report such an impossible number?
I called support and figured out that I had 64 bit counters enabled on devices that do not support 64 bit counters. I unchecked that and started getting realistic numbers. Thanks for helping guys.
Krfitzgerald,
If you have a look at the Interface Details view of the interface, you will be able to see the current "Interface Bandwidth" that has been set in Orion NPM.
This information is retrieved from the SNMP-agent of the device during the addition/discovery of the Node.
At times, the OID (ifSpeed) that is supposed to supply this value has a erroneous value, that will cause the percentage to be inaccurate.
You will have to "Edit" the interface, and tick the checkbox of the Custom Bandwidth, and enter values of what might be the bandwidth.
This is also true, for where an interface that as a Fast Ethernet port that is used for Internet connectivity (e.g. 3Mbps). But the interface speed is not set up, and Orion NPM picks up what is available. If the interface is set as 100Mbps (Fast Ethernet port defaults). You will start to wonder why the bandwidth utilization is extremely low, but you encounter some lack of speed.
If the Internet link is already maxed out at 3Mbps, you might only see that the link is 3% utilized.
HTH.
Two other quick questions. First, what version of the product do you have? There have been some issues in the past addressed in later versions. Second, what types of interfaces are you seeing this with? As Andy mentioned, occasionally the reported speed is actually wrong compared to what can actually be handled by the interface...
Thanks,
Casey
Hi Casey,
I have also encountered a problem recently where a 1 GigabitEthernet interface of a Cisco 3750G switch reached a utilization of near 140% (1.3878 GB). We do not have 10 GigabitEthernet interfaces so burst is impossible. What can I do to resolve this issue? Please advise. Our clients are already thinking that Solarwinds polling is inaccurate.
Thanks.
Hi,
please open a support ticket and attach wireshark trace, Orion diagnostics and interfaces statistics data. We will need those to be able to compare data that device is sending with data Orion is saving to DB. Please filter the wireshark trace by the device's IP address and capture trace for at least 30 minutes (more is better, we need few polls to be captured and default statistics poll interval is 9 minutes). For interface statistics data do simple select from InterfaceTraffic table and save results to file.
Is there anyway to determine this in advance so we can ensure they are set correctly when added to the system?
Interesting. Orion is enabling 64b counters by default for all devices and if device does not support 64b OIDs it should automaticaly use 32b OIDs.
I've seen devices which respond to both 32 bit and 64 bit variants of OIDs, but provide incorrect values for 64 bit ones.
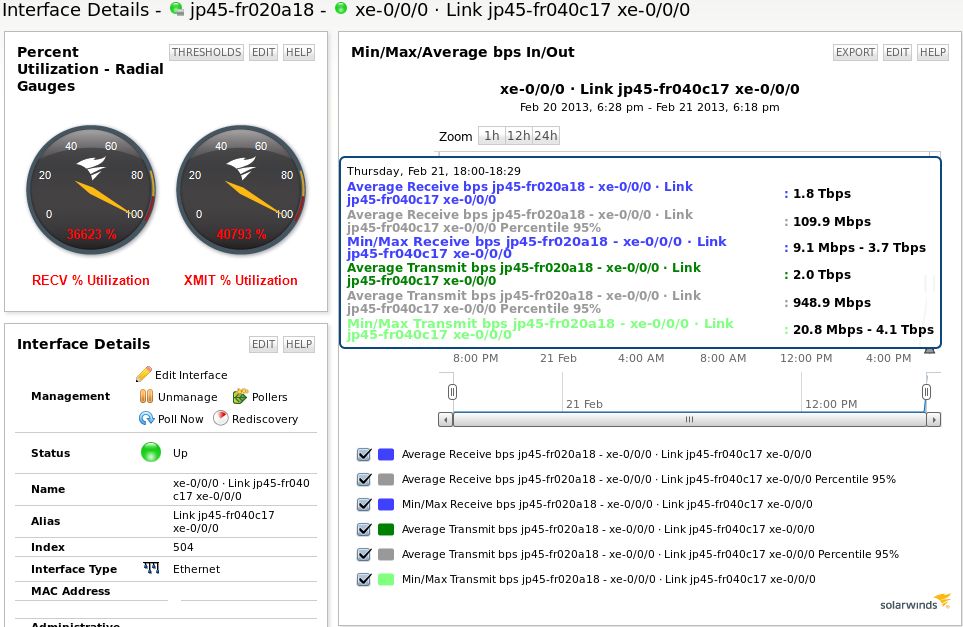
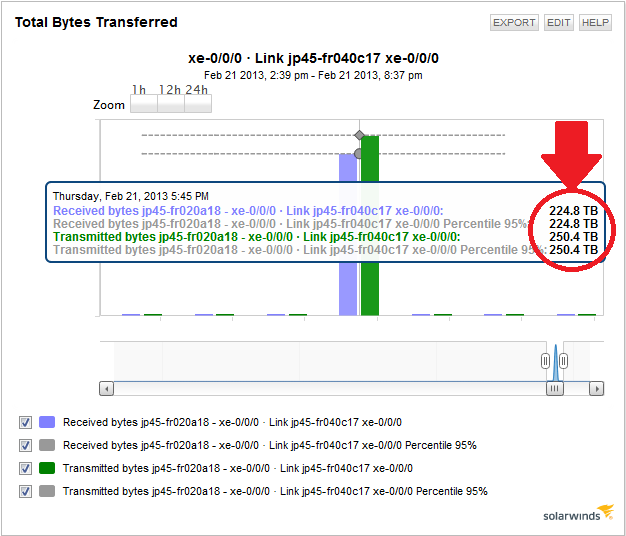
Unfortunately we have a similar problem for which disabling 64b OIDs could not be the right solution. An interface of our juniper 45s is showing exorbitant traffic on an 10GbE interface. 32b counters are too small to handle correct information for these interface types. We tried to fix the displayed values by setting a custom bandwidth of 10000 Mb/s, but this leads either to the same results.
We use NPM v10.4.1 on Win2k8R2 server.
Are there any posibilities to fix this issue?
Kind regards
-sortepeter