I have a UnDP that I have created for my NetApp systems that captures the Percent Disk Space Used. When I display those graphs on the node I always edit the chart to only show that information for the aggregates that I am interested in; it's tabular data so if I don't do this I get the data for all volumes including those I don't care about. Figure 1 below is an example of this.
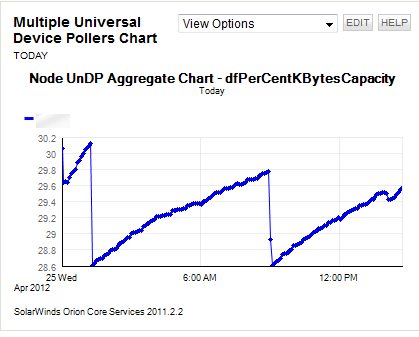
Today I decided to try and create a Multiple Universal Device Poller to show this data for all of my internal NetApp systems in one graph. When I started working with this I got some odd results. The Multiple Universal Device Poller is showing different data for the same NetApp. Figure 2 below is the Multiple Universal Device Poller.
I am curious what data the Multiple Universal Device poller is displaying? Since this is tabular data how does the MUnDP know what data to display?
Thanks in advance for any help on this one!
Figure 1
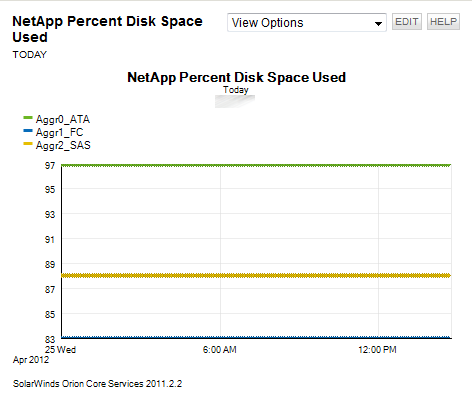
Figure 2