First off I have a case open (# 1085146) but I haven't had a chance to work with support yet. I'm usually able to figure it out on my own or here on Thwack 
In a previous post Can I get group nodes' CPU load charts into one view? another Thwack user (thanks mesverrum!) showed me how to set up Groups to display CPU information for a large group of servers
using a function I had previously overlooked - "AUTOMATICALLY DISPLAY (Metric) RELATED TO THE CURRENT VIEW"
Since I had been creating dashboards displaying CPU, Memory, Disk, etc manually for a lot of my server farms I was pretty excited about using this feature!!!
I should be able to create one Group Dashboard and then just create a bunch of groups and presto! I have all my dashboards done in a jiffy  ..... but now I have run into a snag.
I can't display Volume information using this method 
Is it just my install or is it a future feature request? Can someone give it a try and see if it works in your environment?
I started on my Home Menu and then Groups
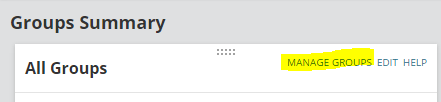
Created a group and added some nodes that were already collecting snmp information for CPU, Memory, and the C drive.
Then I opened the Group Details page for that group and went to 'Customize Page' on the top right.

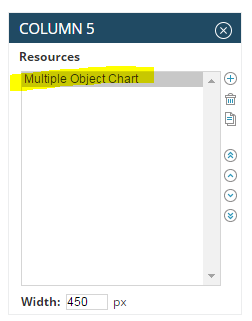
Add a Multiple Object Chart to one of the columns
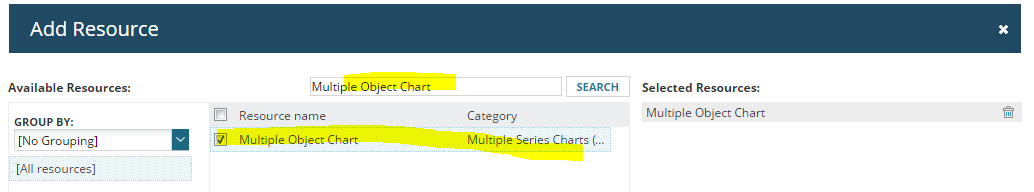
Mine is in Column 5
Preview the chart
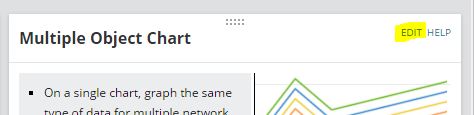
Edit the chart you just added
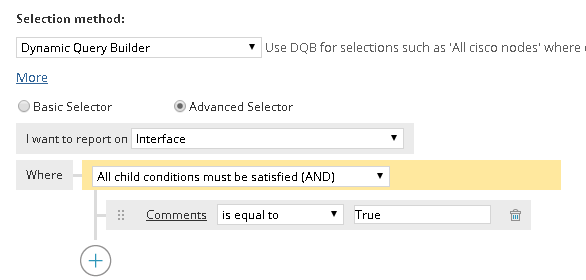
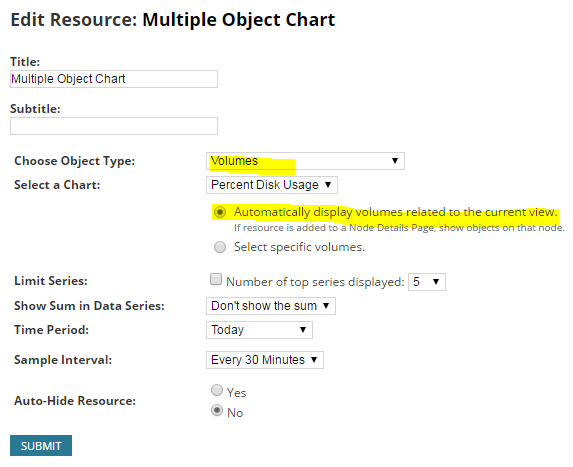
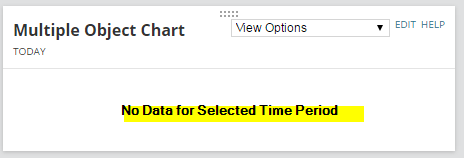
Select Volumes and Automatically display volumes related to the current view then Submit it
(I left it at the default - Percent Disk Usage)
I am getting this
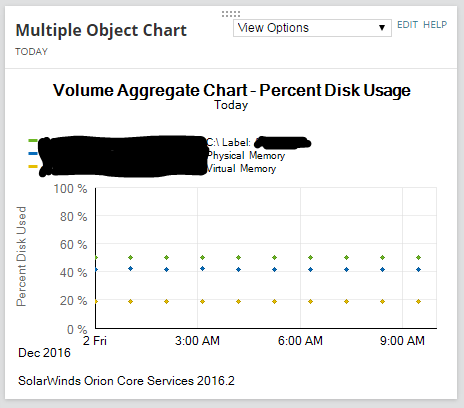
If I manually change it to 'Select specific volumes' and manually add some volumes from that Group it works.
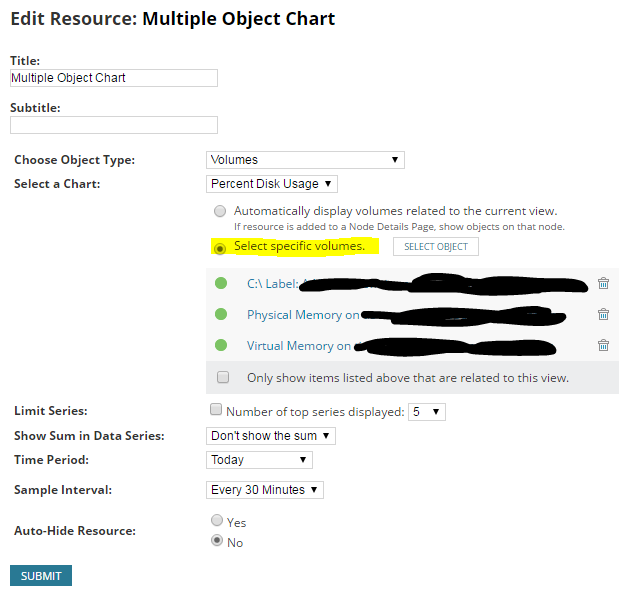
Manually selected - it works, so I know the data is being collected from the node
The other charts for other metrics for this group work fine. CPU Load, Percent Memory Used, and Average Response Time - but not Volumes.
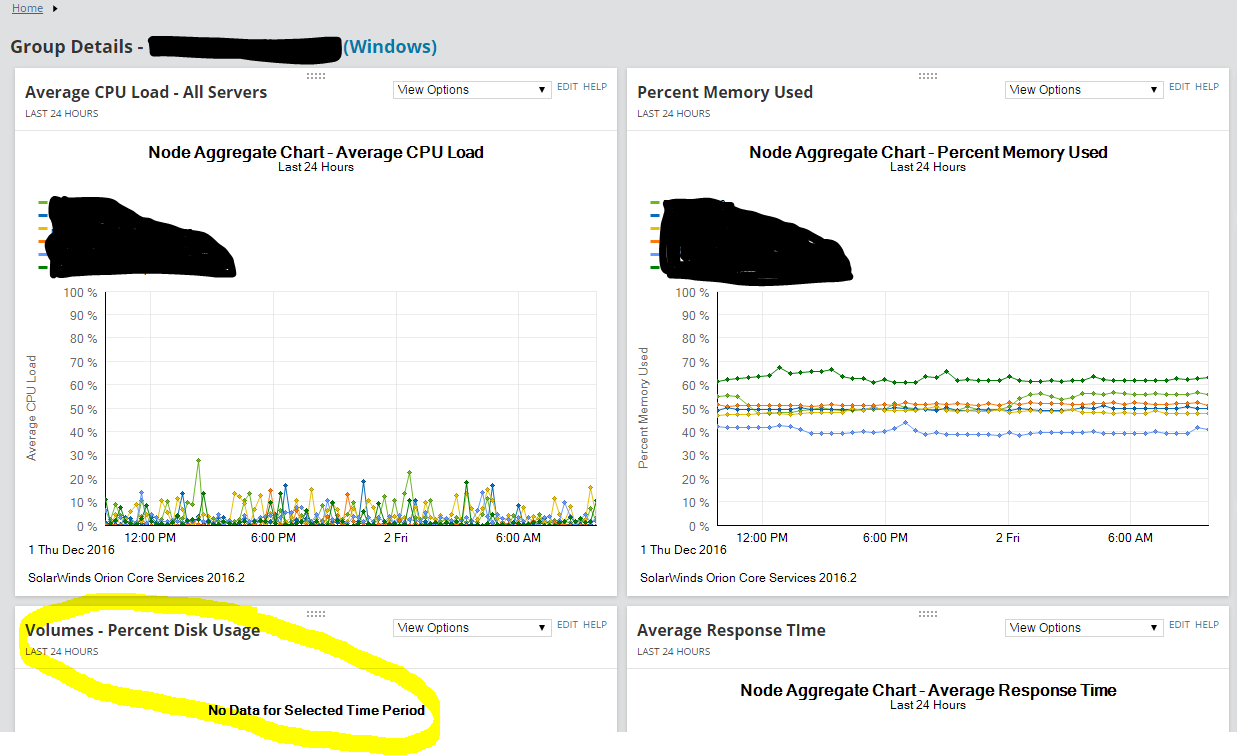
Any ideas?