A number of years ago in an Enterprise Operations world, there were random occurring interface errors. An alert was cultivated to capture and help watch these events and trend interface errors to determine where fiber, sfp's and their connections connections may need to be cleaned and or replaced. So when I heard the request from a client, it only made sense to recreate this alert we used so many years ago. The alert initially was set to check status every 59 minutes, where the initial trigger was determined by an interface having more than 100 errors showing within the last hour. The object was to trend or watch for the reset(s). The alert will reset 59 minutes later if the errors incurred have not continued. When the alert did not reset 59 minutes later the idea is to check interface errors to determine if we have an instance of service for the team.
I used this along with a few other dashboard and detailed resources to constantly trend and spot layer 1 issues, as well as a few configuration issues/misalignment's or full on application/server issues, where the connected interface was tied directly to a server. It's a little tracking, but nothing that a simple email rule can't help manage (as in very specific, not a general 'all orion' rule).
Having some visual resources always did help, but in an enterprise world that can be a lot to look at. This alert made it easy to track some of the high interface error occurrences that did not always show on the Top 10 Error & Discards Widgets, even when those were filtered.
Disclaimer: Some May consider this an informational alert. It can be used as such for tracking errors over time, or adjusted to trigger and reset around a specific threshold and/or sustained condition timing.
This alert will trigger when over 100 errors show on an interface, and will reset the next hour when there are NO interface errors showing.
There is no timing due to the long alert check cycle (checks status every 59 minutes). This of course could be adjusted to 60 minutes, or 119/120 to cover longer times.
Inversely, you could enable timing, and reduce the alert cycle check (condition must exist for X amount of time before triggering) to pickup on a flood of interface errors.
I also like the idea of using Dynamic Alerts (where this has a static value for errors/triggering and errors/resetting the alert - and could be changed to use an interface custom property as a threshold marker per interface), so there is a last line commented out for use of an interface custom property if desired for simple interface detail matching/filtering. Adding a Node CP would need a join, but not impossible.
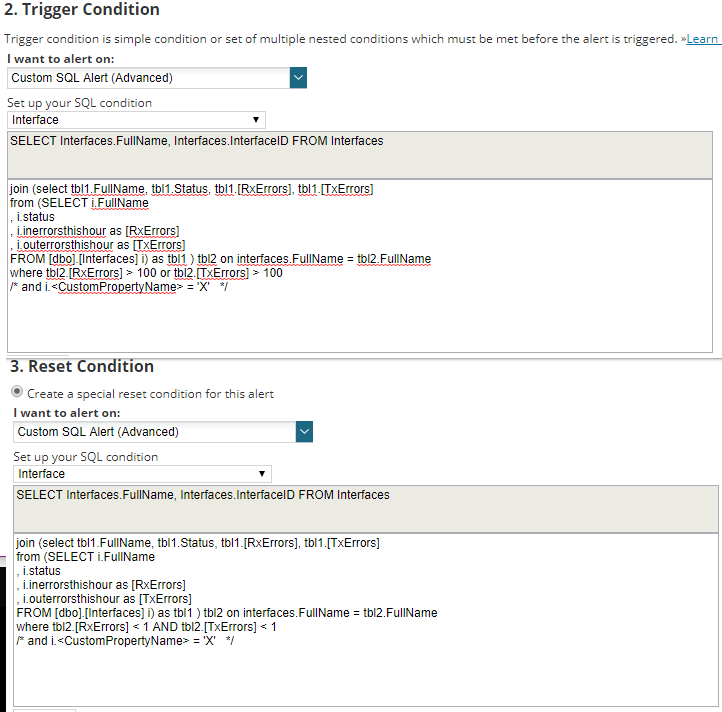
If you want to use a Custom Property to trigger on instead of the 100 or 0 errors adjust the where clause to to following
Alert Trigger: where tbl2.[RxErrors] > *i.CustomPropertyUsedForThreshold* OR tbl2.[TxErrors] > *i.CustomPropertyUsedForThreshold*
Reset: where tbl2.[RxErrors] < *i.CustomPropertyUsedForThreshold* and tbl2.[TxErrors] < *i.CustomPropertyUsedForThreshold*