The magic of the Orion Platform lies in the open database and the flexibility to customize your views using your data. I'll be writing up some common customization requests that we receive for Virtualization Manager, as an ongoing blog post series. If you like a particular customization described, feel free to add a feature request here Virtualization Manager Feature Requests to add it as a default report or widget. We are also looking to see your custom content so send what you have to us here: Send us your VMAN custom content directory for 500 THWACK points!
First, start off with your basic "Custom Table" widget.
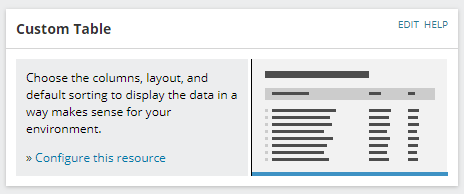
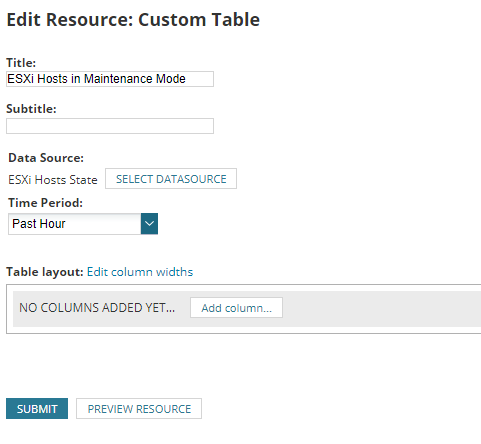
Click "Configure this resource"
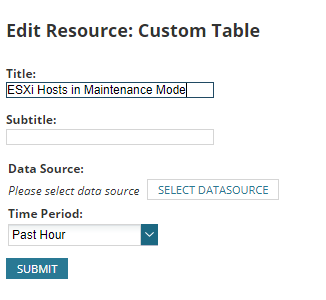
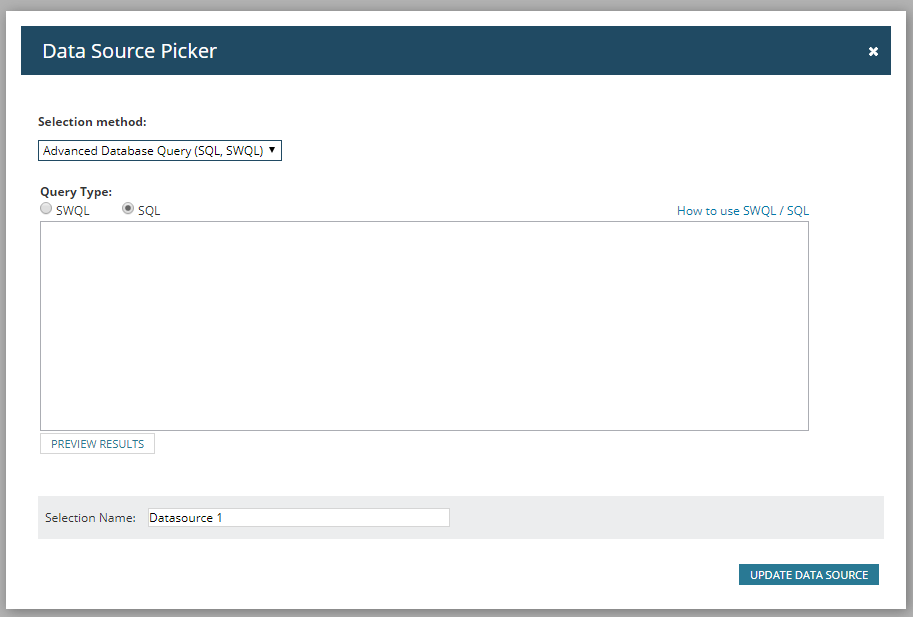
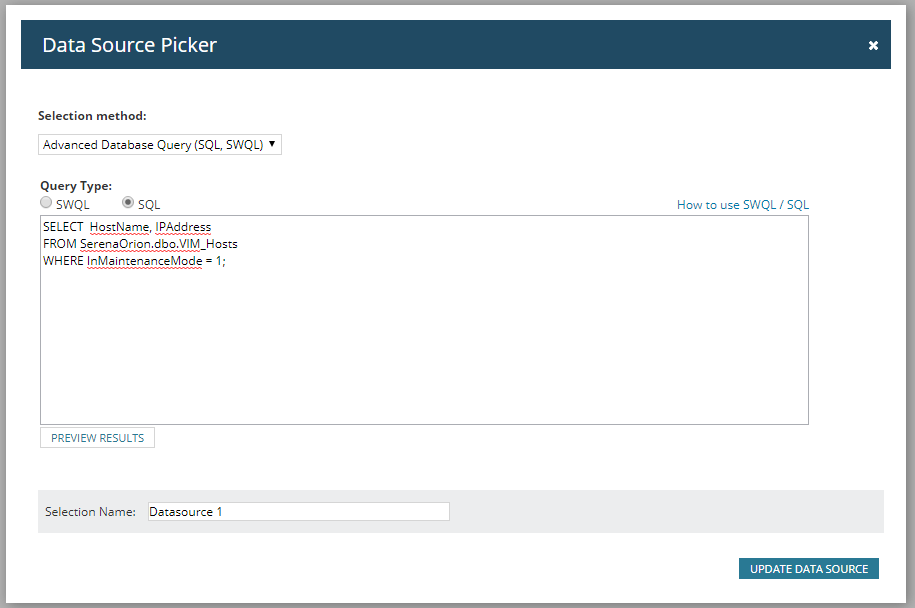
Change the title and subtitle and then click "SELECT DATASOURCE." In this particular example, you'll be changing the selector to "Advanced Database Query" and selecting "SQL"
Now it's time to take a good look at your data. In your Orion database, you'll be looking for a table named VIM_Hosts
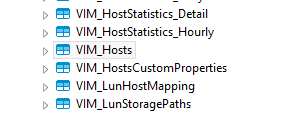
With a small SQL query like
SELECT  HostName, IPAddress
FROM SerenaOrion.dbo.VIM_Hosts
WHERE InMaintenanceMode = 1;
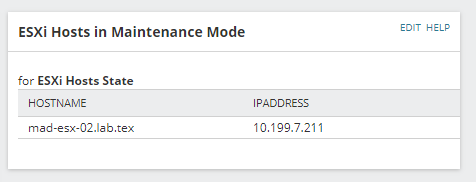
You'll be able to find the Name and IP address of any ESXi host that is in maintenance mode. Add that into the Data Source Picker
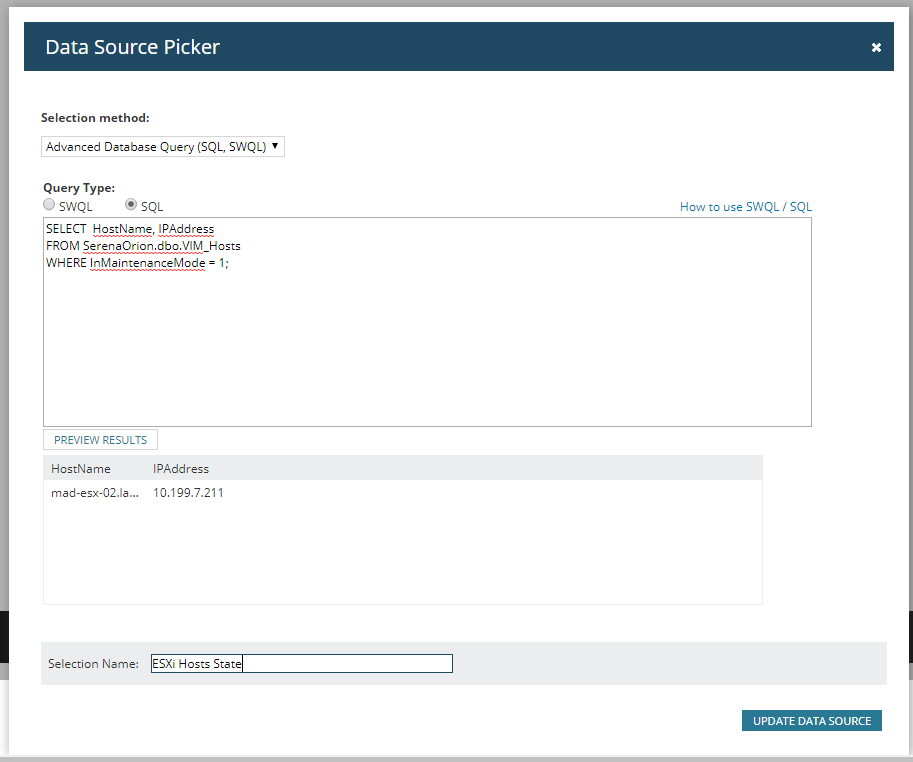
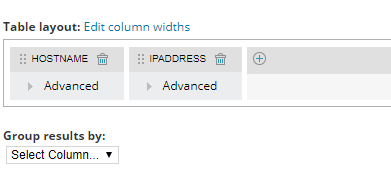
Once you've updated your data source, select your table columns.
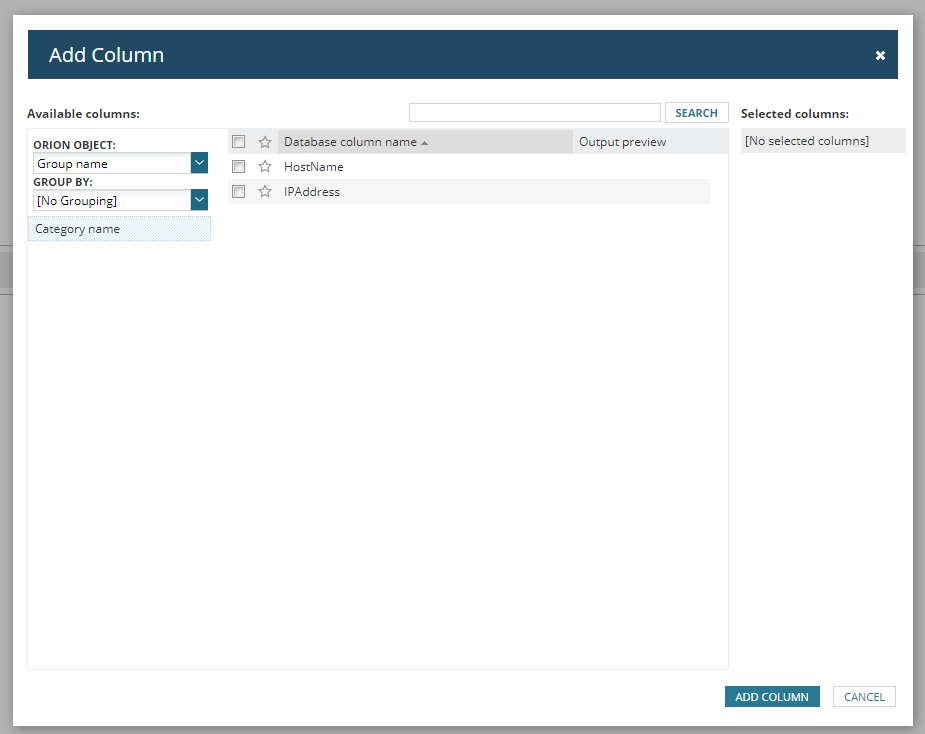
I've chosen HostName and IPAddress, but also choosing not to group the results.
Click submit and there you have it, a widget that can be added to any of your custom dashboards views.
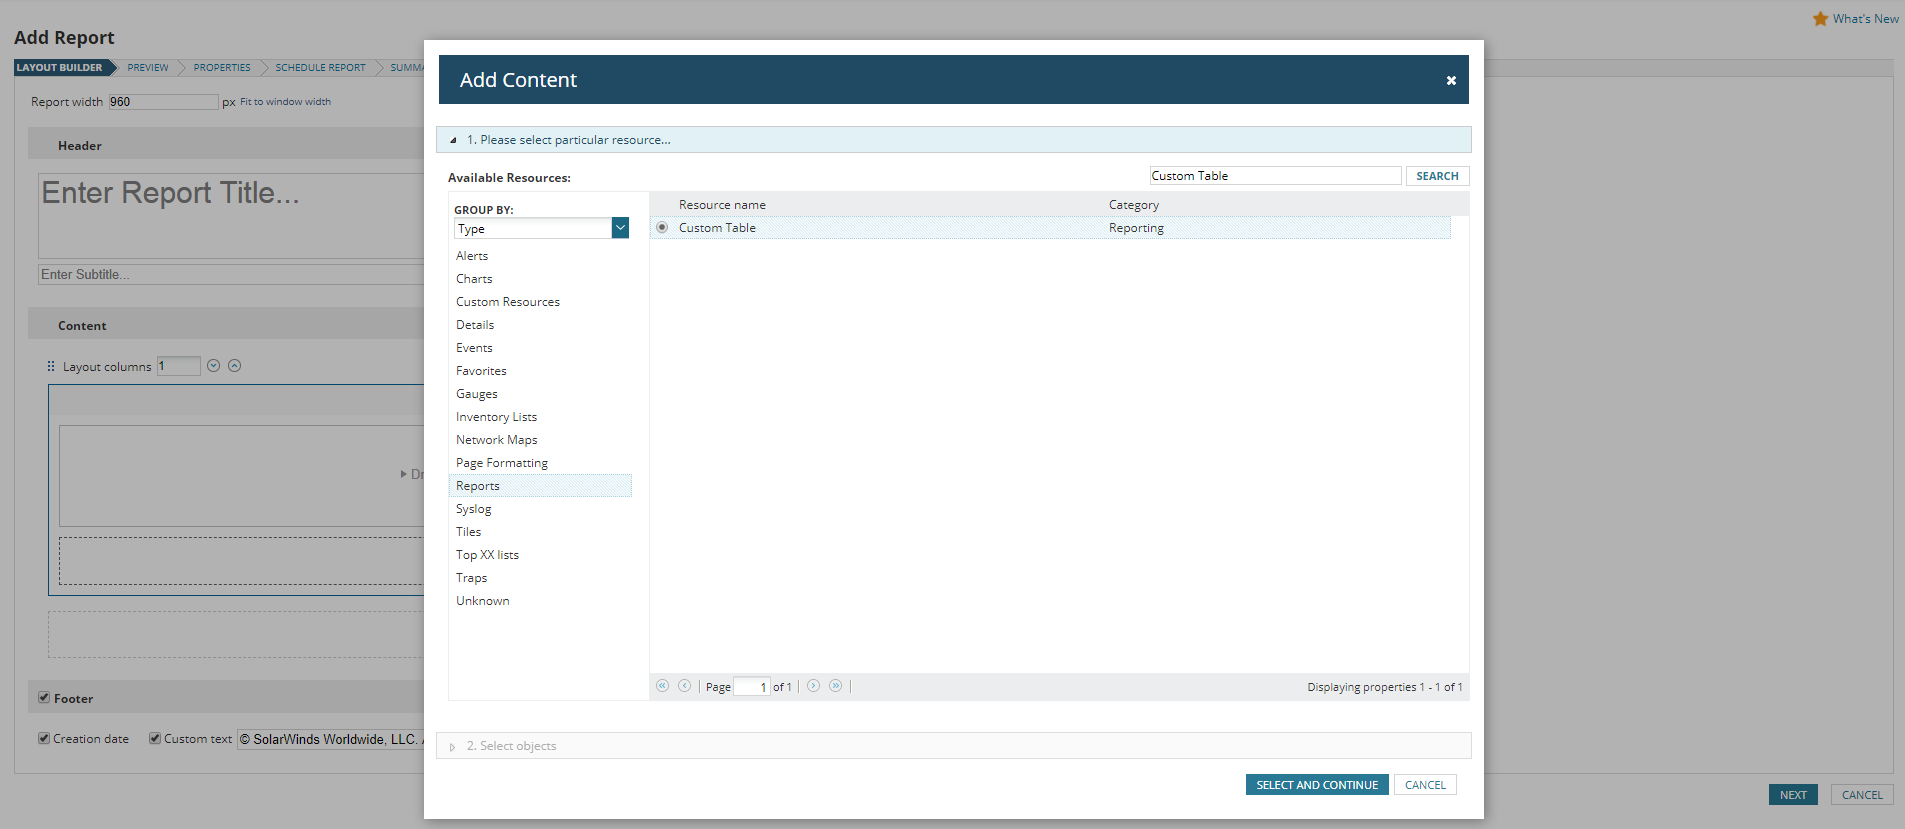
If you'd like to add this data to a report, again the custom table will be your ally. Simply find the custom table and follow the same customization steps that were detailed for the widget

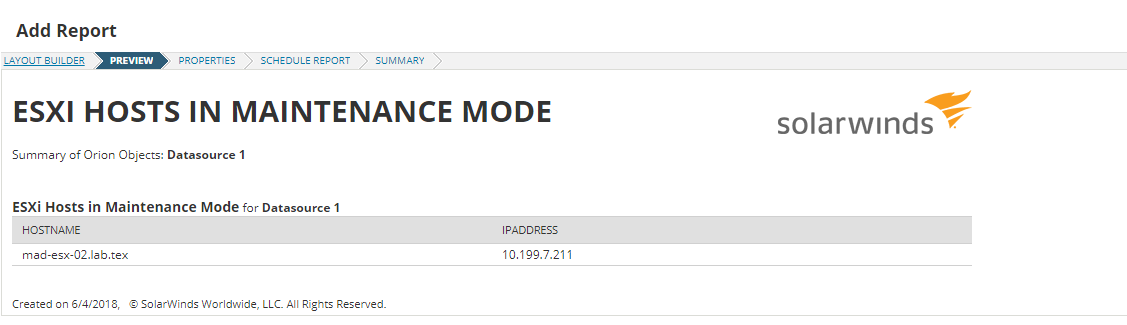
Finalize your report by clicking through the wizard and now you can have this same report emailed to you. What customizations have you done? What would you like to see next?