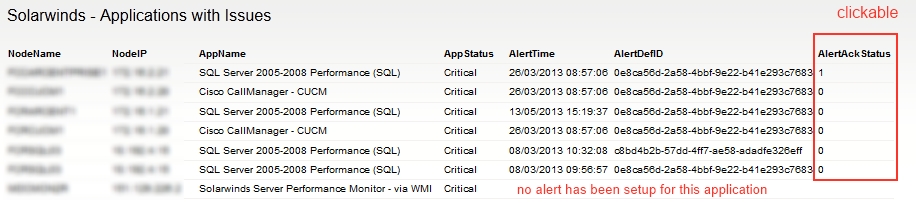
This report will list all applications which are not in UP Status and show the alert time and acknowledge status.
- Works for advanced alerts only
- If no alert information displayed it means no alert has been set-up for that application
- AlertAckStatus column show the alert acknowledge status, 0 = not acknowledged yet, 1 = yes, acknowledged. It is click-able to view/set acknowledgement.
- You may see duplicated alerts with different alert definition ID, it means more than one alert was set-up for same applications, you can use WHERE clause to filter out the unnecessary information.
The advanced SQL query is:
==================================
SELECT
Nodes.NodeID AS NodeID,
Nodes.Caption AS NodeName,
Nodes.IP_Address AS NodeIP,
APM_CurrentStatusOfApplication.ApplicationName AS AppName,
APM_CurrentStatusOfApplication.ApplicationAvailability AS AppStatus,
AlertStatus.TriggerTimeStamp AS AlertTime,
AlertStatus.AlertDefID AS AlertDefID,
AlertStatus.Acknowledged AS AlertAckStatus
FROM
Nodes INNER JOIN APM_CurrentStatusOfApplication ON (Nodes.NodeID = APM_CurrentStatusOfApplication.NodeID)
LEFT JOIN AlertStatus ON (CONVERT(varchar, APM_CurrentStatusOfApplication.ApplicationID) = AlertStatus.ActiveObject )
WHERE APM_CurrentStatusOfApplication.ApplicationAvailability <> 'Up'
ORDER BY AppStatus ASC, NodeName ASC
=============================================
AlertAckStatus column URL: /Orion/NetPerfMon/Alerts.aspx?NetObject=N:${NodeID}&AlertID=${AlertDefID}
Also you can build similar report to show down nodes with triggered time. Please see this post: http://thwack.solarwinds.com/thread/57053
Thanks
