Hello,
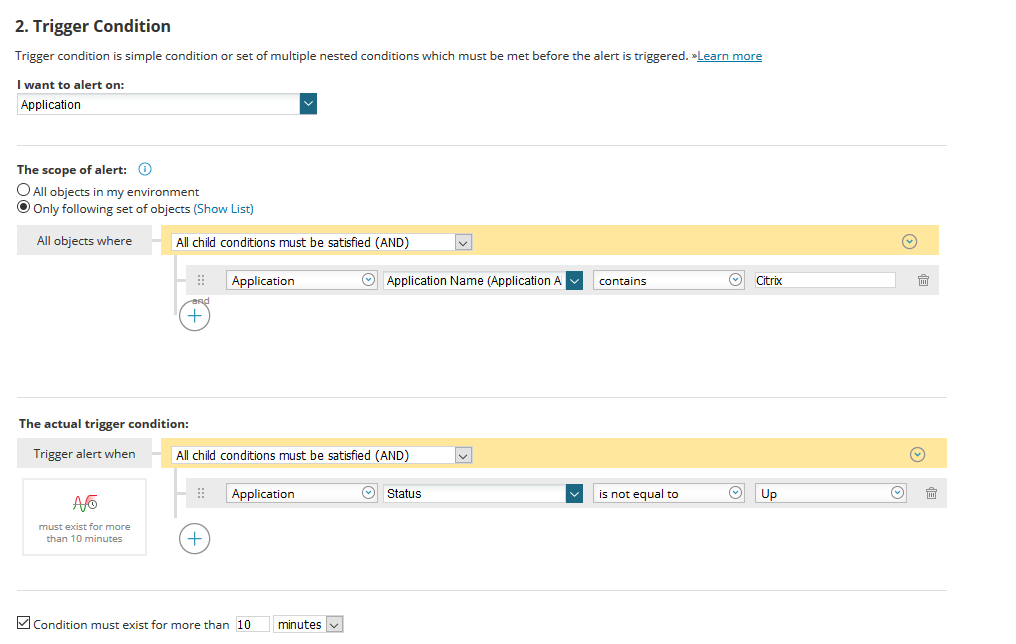
I have set Web Console Settings > STATUS ROLLUP MODE to "Show Worst Status" to show when a Node has any component, application, interface or volume in a status other than up.
This was for the dashboard we setup by use of Groups. All Nodes do have a co-responding custom field set for the associated group name.
The issue I am having is when the Alert is setup, i cannot access the variable that I really want to report on (Group trigger cannot access Application/Component variables. The reason I'm a bit hamstrung on using Group as the trigger is because of the rollup alert capability it has for when a node/app/comp/int/volume has an issue.
The one I am really after is this one - the Group Root Cause drill down status.
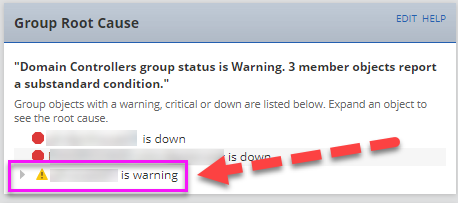
For example, if Citrix has ANY issue, the email below shows everything except the Group Root Cause sub item that shows the actual component/app/int/volume that is in 'not up'.
Trigger Email:
~~~~~~~~~~~~~~~~~~~~~~~~~~~~~~~~~~~~~~~~~~~~~~~~~~~~~~~~~~~~~~~~~~~~~~
${N=SwisEntity;M=Name} - ${N=SwisEntity;M=StatusDescription}
${N=Alerting;M=AlertMessage}
${N=OrionGroup;M=GroupStatusRootCause}
Details on component or application can be seen here:
Monitoring Group: ${N=SwisEntity;M=DetailsUrl}.
Alert Name: ${N=Alerting;M=AlertName}
~~~~~~~~~~~~~~~~~~~~~~~~~~~~~~~~~~~~~~~~~~~~~~~~~~~~~~~~~~~~~~~~~~~~~~~~~~~~~~
Citrix - Warning
Citrix Error
Pxxxxx01 is Warning
Details on component or application can be seen here:
Monitoring Group: https://xxxxxxx/Orion/NetPerfMon/ContainerDetails.aspx?NetObject=C:7.
Alert Name: Citrix
~~~~~~~~~~~~~~~~~~~~~~~~~~~~~~~~~~~~~~~~~~~~~~~~~~~~~~~~~~~~~~~~~~~~~~~~~~~~~~~
I understand I may need to make joins from the below but, can i just use the variable that shows on the widget above?
[APM_CurrentComponentStatus]
[APM_Component]
[APM_Application]
[NodesData]
[Containers]
[ContainerMemberDefinitions]
I hope I have explained this well and really appreciate any help I could receive.
Regards,
MTZ