The standard widgets supplied with the SEM dashboard are not fit for purpose.
Many are limited to 10,000 events and give no indication of what timescale they cover.
We are seeing over 1,200 EPS. So these widgets might max out in less than 10 seconds!
The figures shown in the widgets are meaningless without some additional time frame information.
Take for example our Firewall events by type widget:
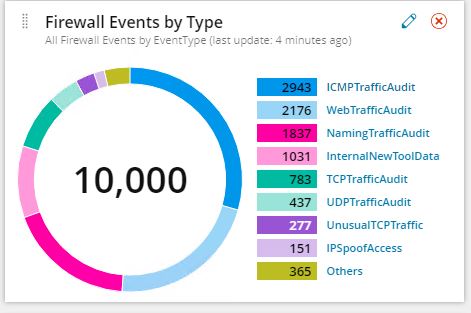
There are lots of statistics here, but they mean nothing without some qualification of the time period over which they were taken.
With 1,200 EPS we'd max out all all of those event types in a very short space of time, yet with the exception of the central 10,000, they are not maxed out?
So what is the time period? Only SEM developers know this. Maybe the numbers are the remainder after continuous overflows?
So my request is:- I would like to see the number of events handled by these types of widgets dramatically increased AND the time periods used clearly indicated & preferably configurable.
For me, I want my dashboards to show what has been happening recently, eg. the last 24 hours or the last week, not since the beginning if time. I can use reports for that sort of information.
I have been told by SW in response to tickets that these widgets show statistics from ALL events in the DB. However, the numbers don't seem to back up this assertion.