I'm quite confident with NPM/SAM and wrote many some PowerShell monitors.
Now i got the task to monitor several Poseidon temperature/humidity/water sensors.
I was able to import the nodes with SNMP and created Universal Device Pollers and also transformers to show the values with units and also show a graph. Works great.
Then I created Universal Device Pollers for the name of each sensor (max 3) and the alarm value of each sensor (0 = error, 1 = good, 2 = alarm).
The sensors are not in the same order on the devices. Sensor 1 (1.3.6.1.4.1.21796.3.3.3.1.2.1) could be temperature on device 1 but humidity on device 2. So, I also gather the sensor names.
Next step was to create an alarm, which works fine:
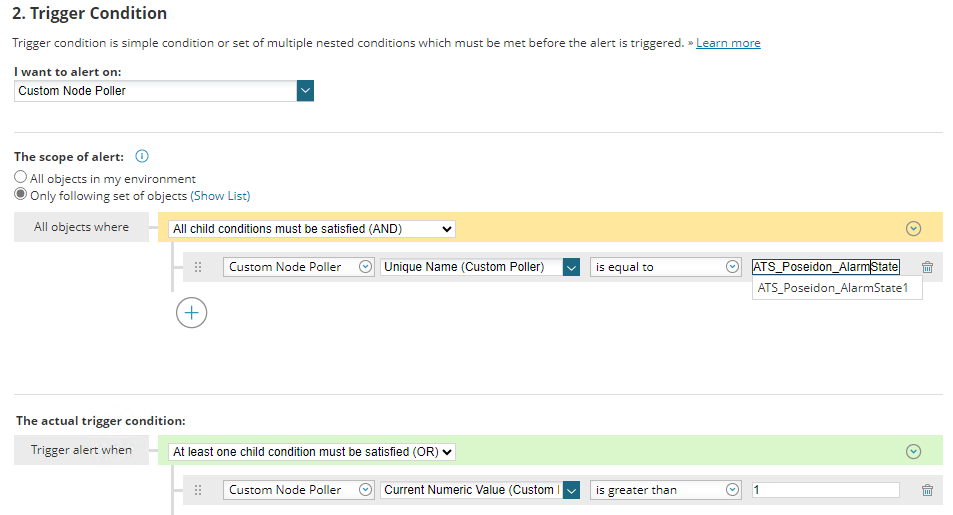
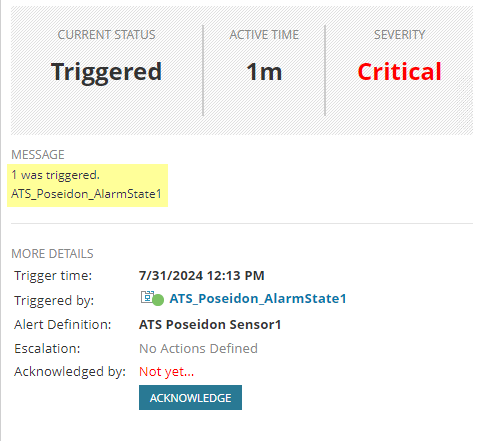
But of course, now I only get a very abstract alarm message, not telling me the values or the name of the sensor
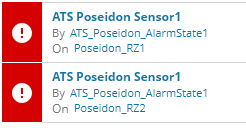
Alerts summary:
and alerts details page
Universal Device Pollers:
ATS_Poseidon_AlarmState1-3 triggers the alarm
ATS_Poseidon_SensorNameState1-3 has the name of the sensor (Humidity, Temperature or Water Leakage)
ATS_Poseidon_SensorValue1-3 has the value of the sensor
I would like to ask for your help how to display the corresponding sensor names and values in the alert's summary and also the alerts details page.
Ideally, I would see that the Temperature sensor of device "Poseidon_RZ1" reports 50 (i don't care of the units, i can add them later) or the humidity sensor reports 90.
Nobody should need to open the device page itself but already know from the alarm what's going on.
Thank you for your help ")

