Hello everyone,
I have been struggling to get historical data of top 10 processes that are contributing to CPU load on a server. Yes, i enabled canned alert that gives top 10 processes information on the alert notes and on email when we have high CPU usage. we are doing an analysis on the devices that are getting lot of high CPU usage alerts. For this investigation, we are looking for historical data of top 10 processes for example for last one week, with hourly sample interval, what are the contributors.
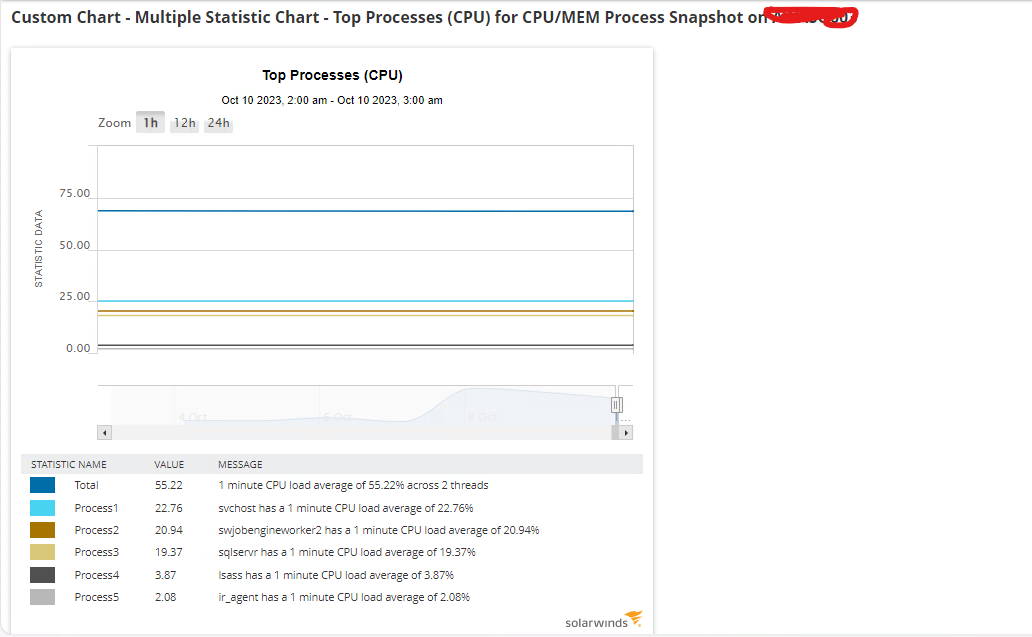
From thwack, i got one custom SAM template (CPU/MEM snapshot), i imported this template and assigned it on a device to test. It started capturing the data of top 5 processes but when i want to extract the data, the values are not changing from the information column of graph (static name, value , message remains same - in the below screenshot)
https://thwack.solarwinds.com/product-forums/server-application-monitor-sam/f/forum/31979/top-processes-by-cpu-mem-widget-for-node-details
I am badly looking for someone help in this regard if anyone has gone through this requirement already. Please help.
Thanks.