Dashboards, Dashboards, Get Your Dashboards!
The Orion® Platform Team is proud to announce a new modern dashboarding framework. This, data-driven and highly performant dashboard framework provides Orion users with a greater level of flexibility over how their dashboard data is displayed.
A grid-based layout, new widgets types, drag and drop placement with full vertical and horizontal widget scaling all provide users with increased control over the layout of the dashboard.
There is also one more really awesome feature of the new dashboarding framework which I love, but, you will have to read on to find out more about it!
For the full list of Orion new features and improvements visit: Orion Platform 2020.2 Release Notes - New Features
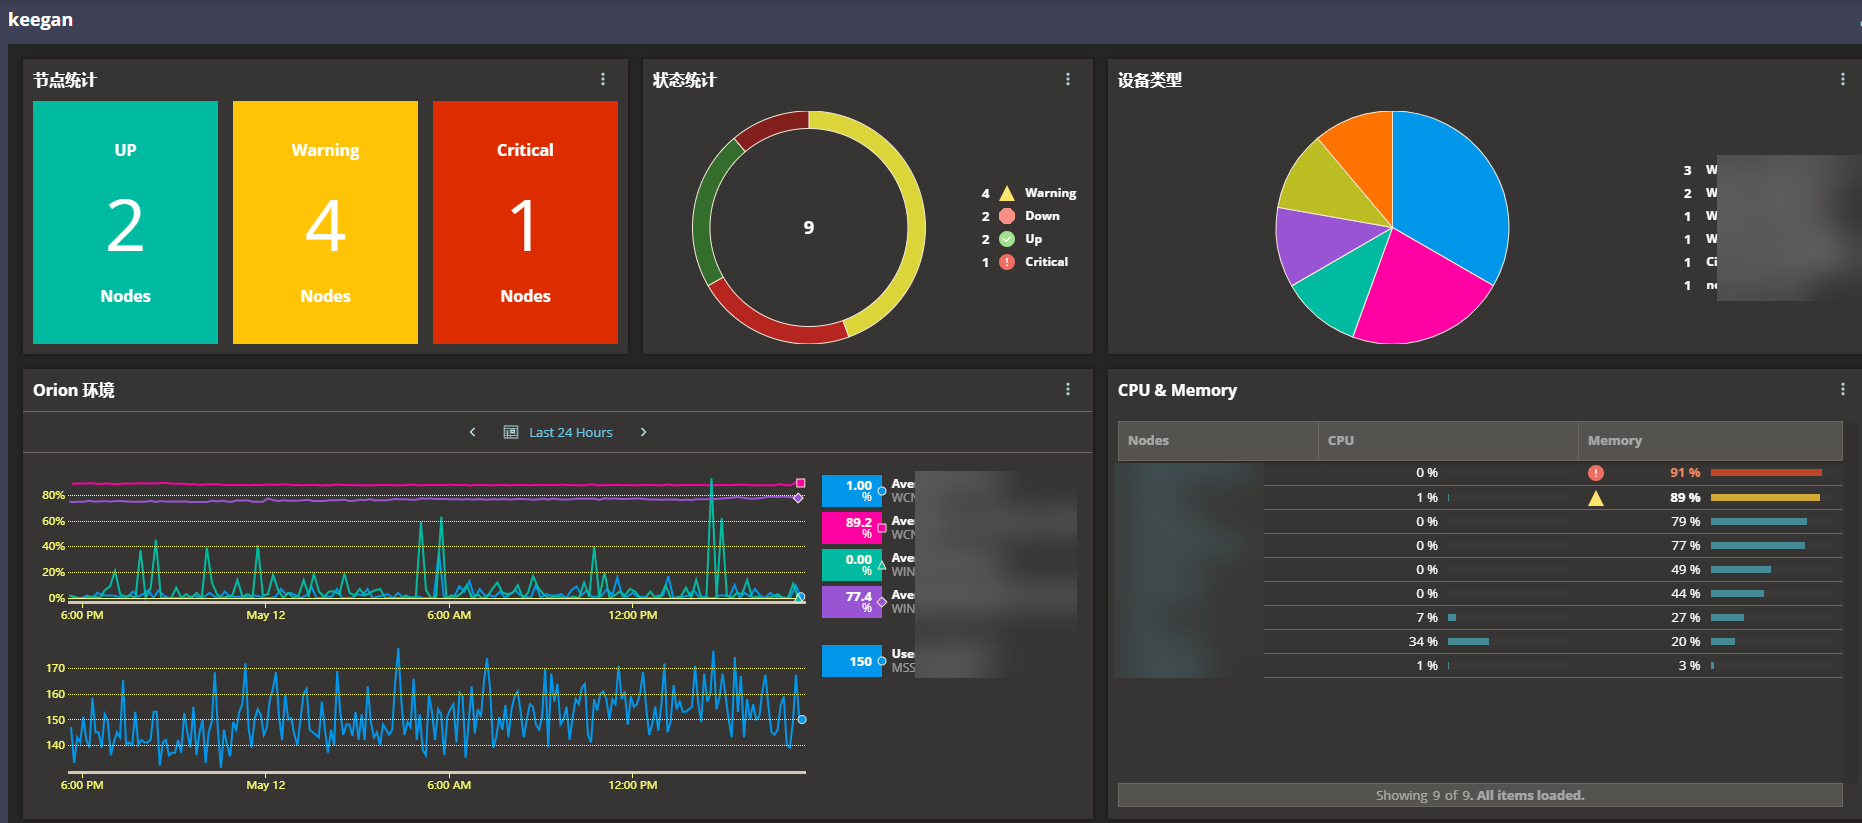
Example Modern Dashboard
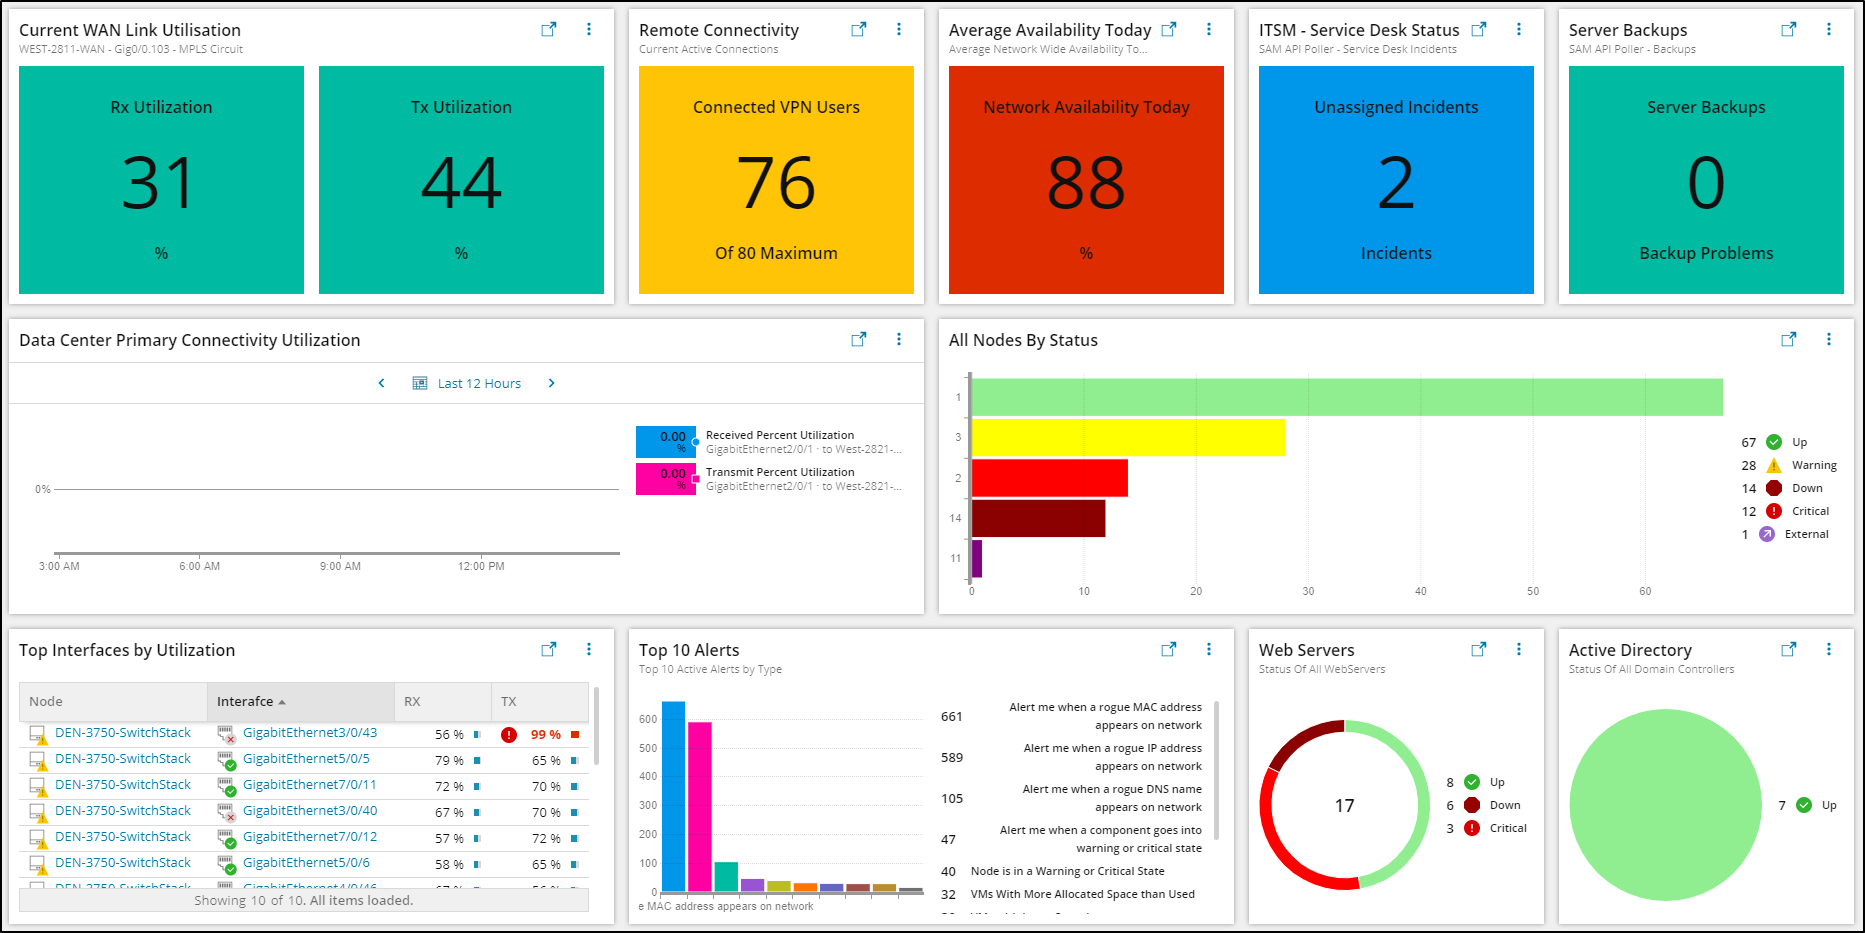
New widgets types, visually compelling, status and threshold driven indications.
Summary Views, Classic and Modern Dashboards, what’s the difference?
Orion modules provide many great examples of dashboards such as the Network Summary, Application Summary, and Top 10 dashboards. These are based on classic Orion views which contain resources whereby a Summary View is suited to displaying high-level information across all monitored entities such as All Nodes, All Volumes All Applications, etc.
In the realm of Summary Views and Classic Dashboards, the two terms are interchangeable. Additional view types are available for displaying information related to a specific entity such a Node Details, Application Details etc. Modern Dashboards are not intended to replace these existing Summary Views, but rather offer you an alternative method for presenting the data in your dashboard.
This is the 1st iteration of the new dashboard framework which will evolve with each subsequent release. Your feedback is central to this evolution and so I would encourage you to send any feedback you may have, positive or negative so that we can continue to deliver features that you want.
Let's Get Started - Manage Dashboards
The Orion Veterans amongst you will likely have already seen the additional menu item 'Manage Dashboards' under 'All Settings'
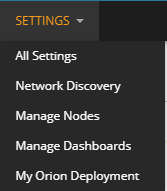
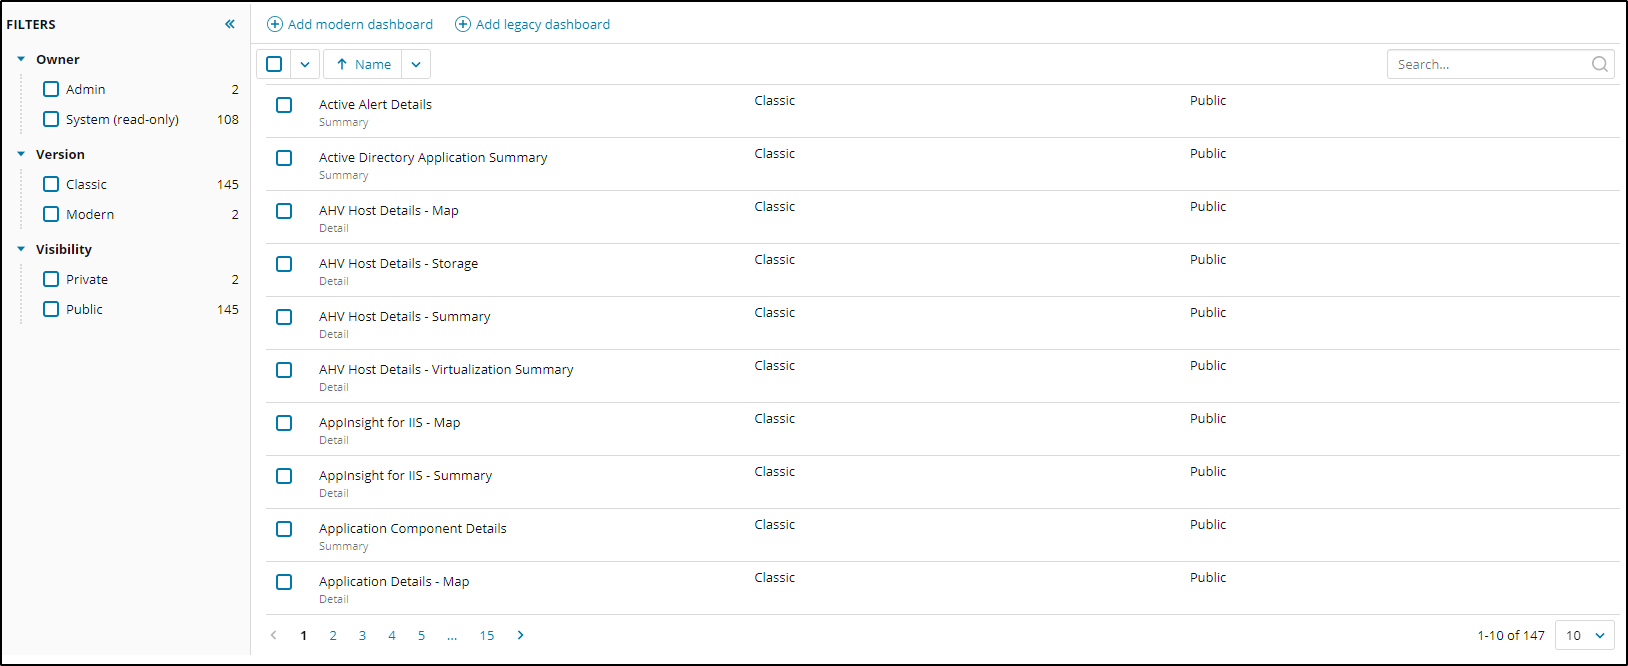
Manage Dashboards is your one-stop-shop for managing classic views and modern dashboards, it replaces the 'Manage Views' link in All Settings. It allows you to filter all dashboards based on Owner, Version & Visibility.
Dashboard Security
The dashboard security model differs from the classic view security model.
- Dashboards can be created by ALL Orion Users, Manage Views Permission is not required
- Admins can see and edit ALL dashboards
- Non-admins can see and edit dashboards they own
- Dashboards visibility can be Public Or Private
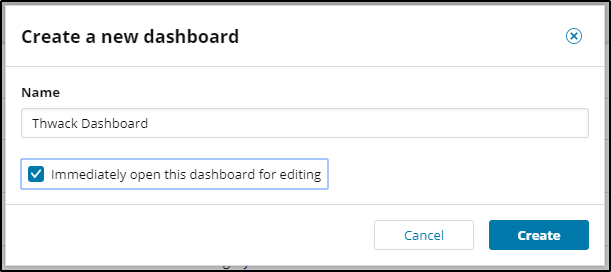
Go ahead, click create ‘Modern Dashboard’.
Give the dashboard a name and 'Immediately open this dashboard for editing'
Drag And Drop a new widget to the dashboard and click Finish Configuring

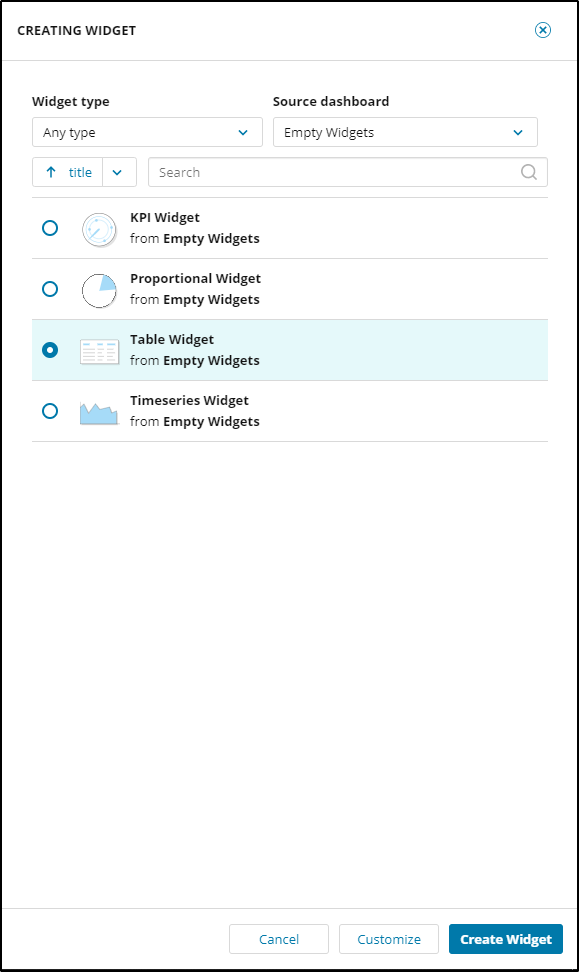
The Widget Cloner Panel presents you with the 4 widget types available. As you create new dashboards and widgets, these will be readily available for you to clone as you edit the dashboard.
Clicking Create Widget will save an empty widget to the dashboard. Select the Table Widget and Click Customize to configure the widget.
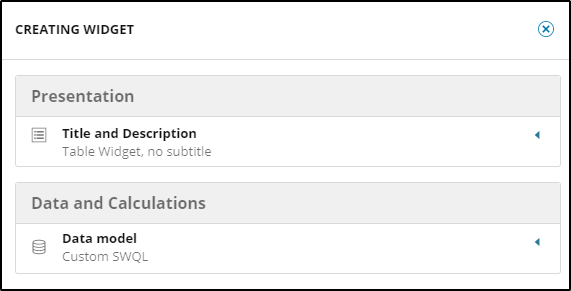
All widgets have 2 common configuration elements, Presentation and Data Model.
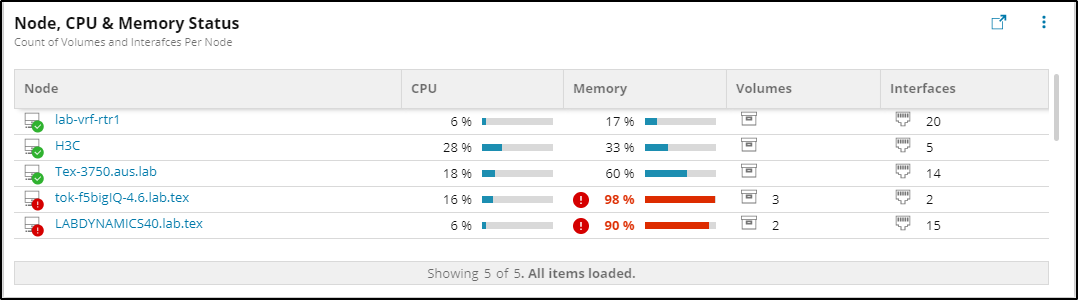
Widget Configuration Table Widget
The table widget is designed to display tabular data. Let's take a look at what is required to build the following table which shows:
- The Node Status
- Current CPU Utilisation with warning and critical threshold indications.
- Current Memory Utilisation with warning and critical threshold indications.
- Number of monitored Volumes on the Node
- Number of monitored Interfaces on the Node
Widget Presentation
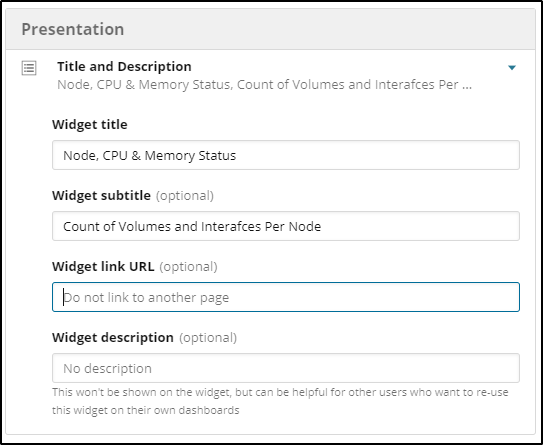
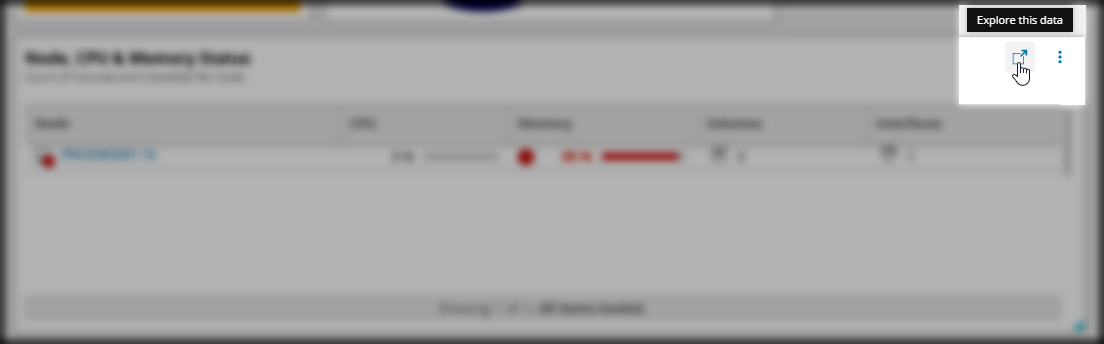
Notice the Optional Widget Link URL? Here you can provide a link to another Orion URL or other external URL. The widget will display the 'Explore Data' button on the top right-hand side.
The Data Model
All dashboard widgets are data-driven. Based on SWQL users can define their own Custom Query or use the in-built Graphical Query Builder. The data model can be presented in a number of different formats, and the output of the query will need to match the type of widget you are creating. For those who may not be familiar or comfortable writing SWQL we have provided a graphical query builder that is covered in more detail below.
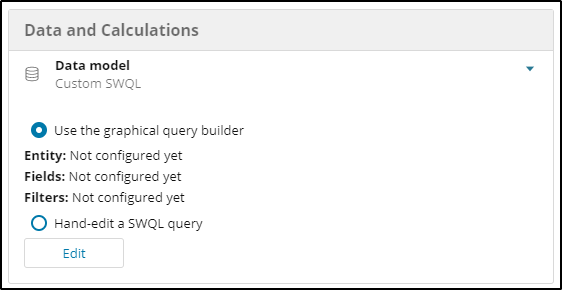
If choosing to hand-edit a SWQL query, the editor allows you to explore all entities and import a SWQL statement which selects all columns.
Pro Tip! The 1st rule of SWQL: there is no SELECT *

For this task, we are going to use the Visual Query Builder to define the Data Model configuration. The visual query builder can be used to quickly build a data model across multiple entities without having any knowledge of the entity relationships, put simply it creates the query and required joins for you!
- Use the graphical query builder to edit the data model for a table widget.
- Choose the Node for the row type.
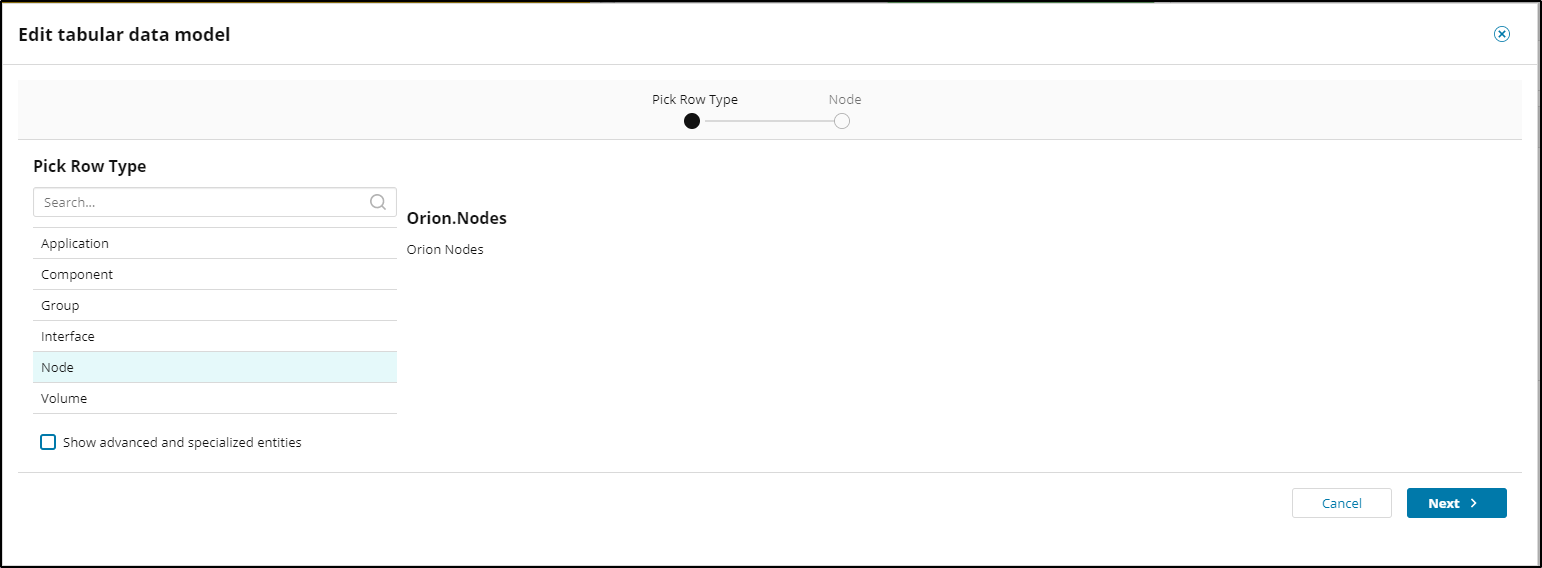
- Select the check box "Show advanced and specialized entities"
- Drag Caption, Status, DetailsUrl, CPULoad, PerecentMemoryUsed, Volumes.Caption, Interfaces.Caption
- The Orion Nodes entity has a 1 1:Many relationship with both Interfaces and volumes, the query builder allows you to aggregate the rows to provide Count, Min, Max, Average aggregations.
- Save the Data Model

We must now choose which columns will be displayed in the table, click add new column
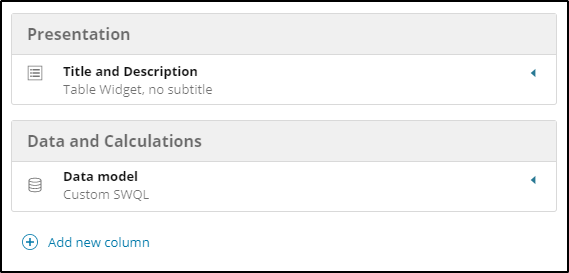
Each Column has 2 configuration elements.
- Description
- Property & Formatting
Define the description for the field such as 'Node' and expand the Property and formatting panel. Here you can choose from a section of preconfigured formatters. For the node column, we will use Orion Entity. This presents additional field mappings.
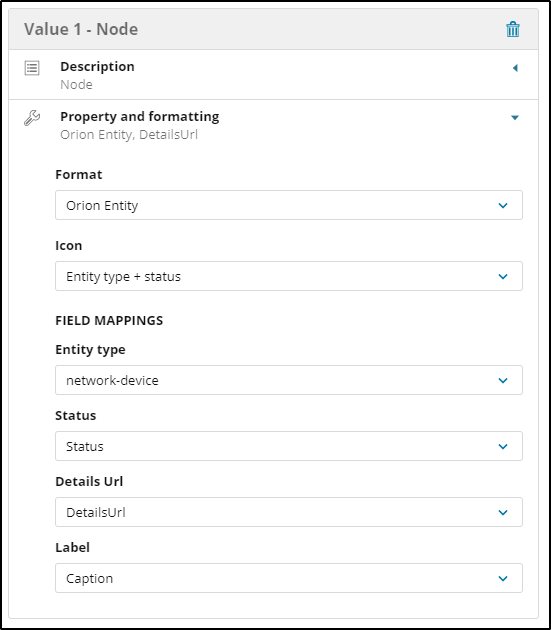
Status, DetailsUrl and Label all match back to columns selected in the query builder. The Entity type is the icon of your choosing from the supplied list.
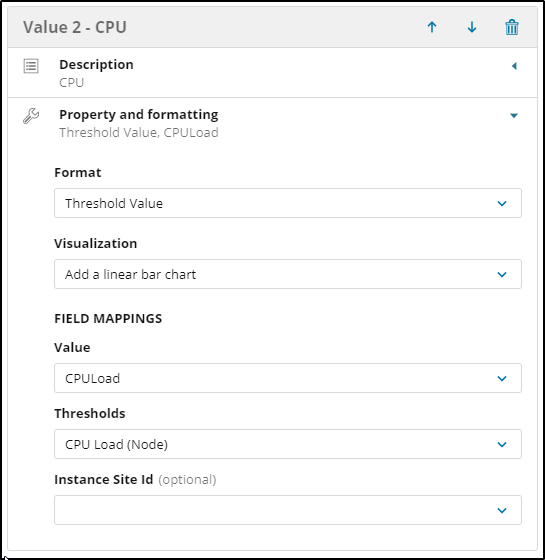
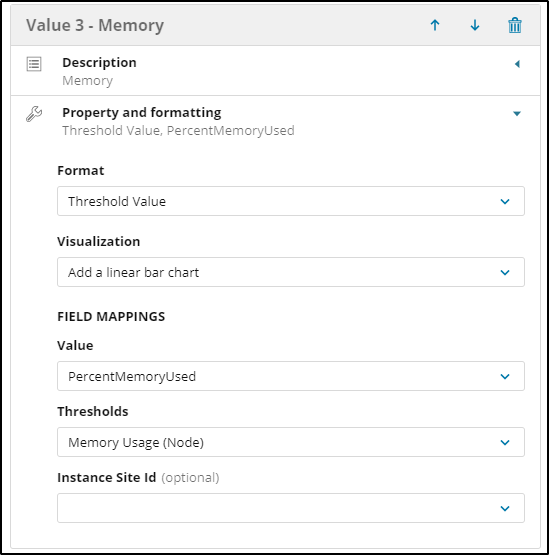
The CPU and Memory Columns use a 'Threshold Value' for the format. There are many threshold formats available based on Orion thresholds for the metric such as response time, packet loss, IOPS, Interface Utilisation & many more. The Interface and Volume Count Fields both use a Simple Number Formatter.
| CPU Value Configuration | Memory Value Configuration |
 |  |
| Volume Count Value Configuration | Interface Count Value Configuration |
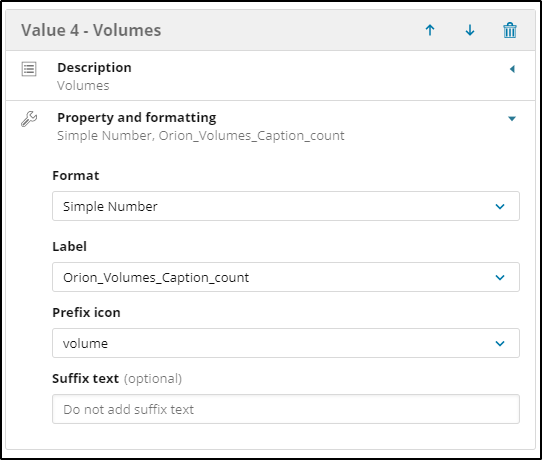 | 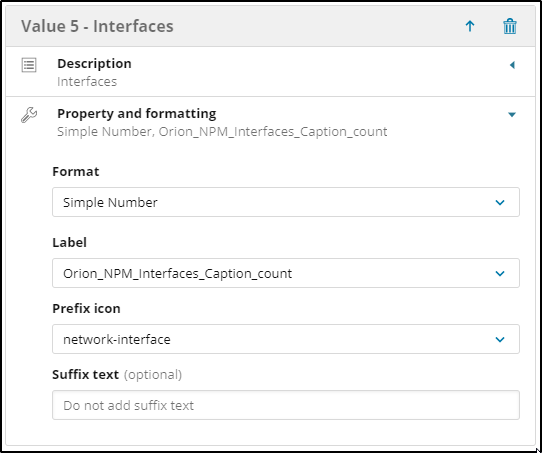 |
KPI Widget – The Big Number
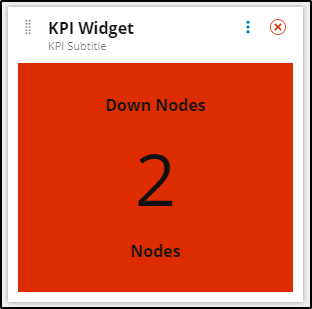
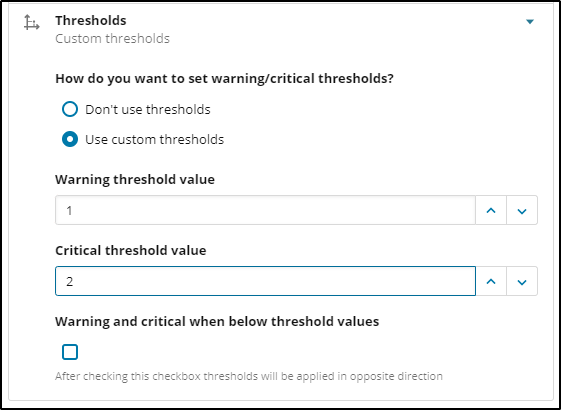
KPI widgets display a big number representing a certain metric. You can add multiple KPI cells to an individual KPI widget, select a default background color, and can have a warning and critical threshold applied to the observed values.
The data model for a KPI should return a single number. Here are some example queries to get you started.
| Description | Query |
| Total nodes that are in a down state. | SELECT COUNT(1) AS KPI_Number
FROM Orion.Nodes
WHERE Status = 2 |
| Total Number of Active Alerts | SELECT COUNT(o.AlertConfigurations.Name) AS [KPI_Number]
FROM Orion.AlertObjects o
WHERE o.AlertActive.TriggeredMessage <> ''
|
| CPU Load of a node with caption PRODMGMT-16 | SELECT n.CPULoad
FROM Orion.Nodes n
WHERE n.Caption = 'PRODMGMT-16' |
Proportional Chart
The proportional chart allows you to chose from 4 subtypes
- Pie Chart
- Donut Chart
- Horizontal Bar
- Vertical Bar
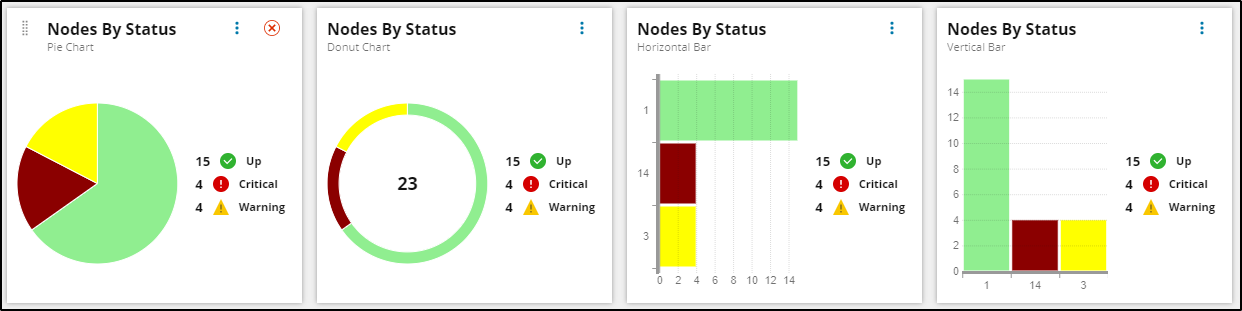
Data models for proportional charts require two fields, one of which must be numerical, the other is used as a grouping. e.g how many nodes do I have, grouped by their status?
In this example, the ‘how many nodes’ is the number we need and the status will be used to group the data.
| Description | Query |
| Count Nodes by Status | SELECT COUNT(1) AS Count_Items
, Status
FROM Orion.Nodes
GROUP BY Status |
| Count Applications By Status | SELECT COUNT(1) as Count_Items
, Status
FROM Orion.APM.Application
GROUP BY Status |
| Count Interfaces By Status | SELECT COUNT(1) AS Count_Items
, Status
FROM Orion.NPM.Interfaces
GROUP BY Status |
Select the matching Value and Category Fields to display the data.
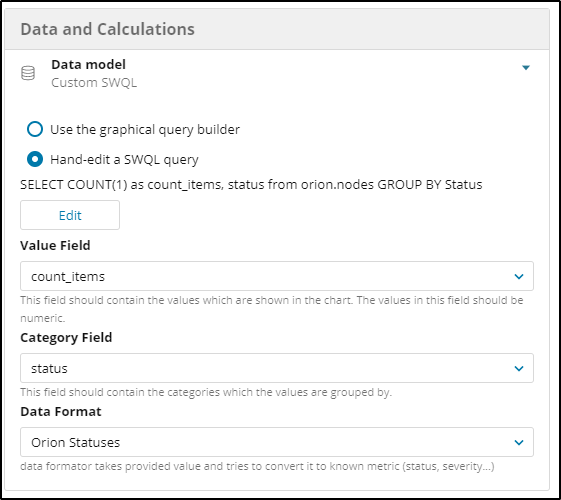
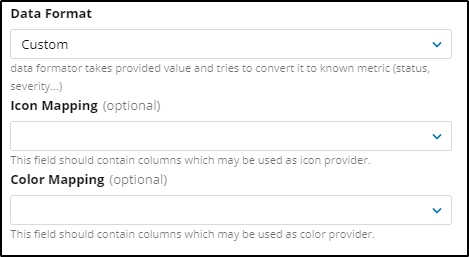
Notice the Data Format? The proportional chart can map the status values returned by the query to meaningful text and will show these in the legend.
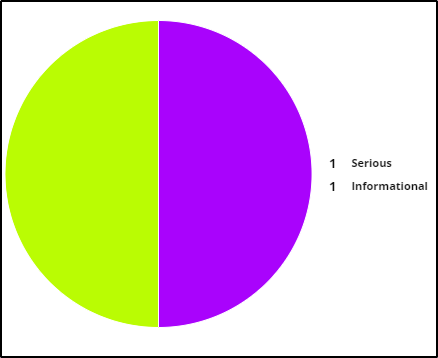
Pro Tip! Want to provide your own custom color mapping? Define the colors in your query and choose Custom from the data format
SELECT Count(o.AlertActive.TriggeredMessage) AS Item_Count
      , CASE
            WHEN o.AlertConfigurations.Severity = 1
                  THEN '#03fc7f'
            WHEN o.AlertConfigurations.Severity = 2
                  THEN '#a903fc'
            WHEN o.AlertConfigurations.Severity = 3
                  THEN '#ebfc03'
            WHEN o.AlertConfigurations.Severity = 4
                  THEN '#bafc03'
            WHEN o.AlertConfigurations.Severity = 5
                  THEN '#fc2403'
            END AS [Color]
      , CASE
            WHEN o.AlertConfigurations.Severity = 1
                  THEN 'Critical'
            WHEN o.AlertConfigurations.Severity = 2
                  THEN 'Serious'
            WHEN o.AlertConfigurations.Severity = 3
                  THEN 'Warning'
            WHEN o.AlertConfigurations.Severity = 4
                  THEN 'Informational'
            WHEN o.AlertConfigurations.Severity = 5
                  THEN 'Notice'
            END AS [Severity]
FROM Orion.AlertObjects o
WHERE o.AlertActive.TriggeredMessage <> ''
GROUP BY o.AlertConfigurations.Severity
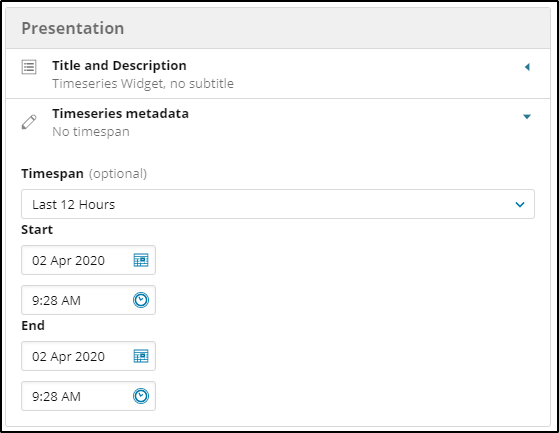
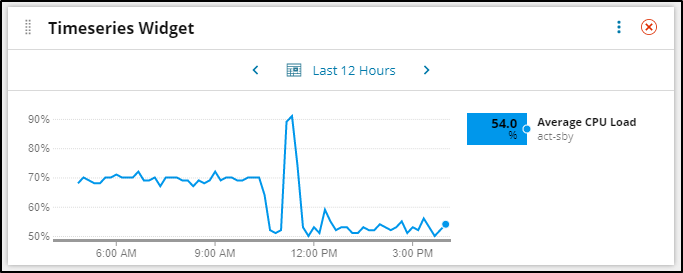
Time Series Widget
This one is gimme, no reinventing the wheel here. The Time Series widget allows you to display a PerfStack project. One caveat, however, it supports line charts only at this time.
To learn more about the powerful performance analysis and metric correlation capabilities available in PerfStack, I highly encourage you to read through Troubleshooting environmental issues with Performance Analysis dashboards
The time series widget has an additional configuration within the presentation panel allowing you to define the time span to display
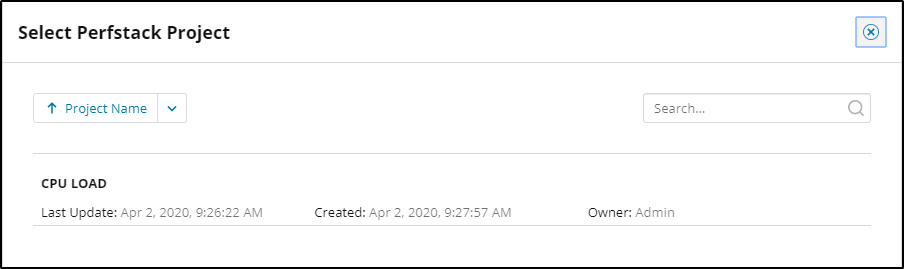
Editing the data model for a Timeseries widget presents a dialog to choose an existing Perfstack Project
Pièce de résistance..
Auto update without page refresh
If you have gotten this far reading through everything and are eagerly waiting to find the awesome feature I mentioned, I salute you. If you blindly scrolled down to get here, well I salute you too but you have missed out on some great info!
Notice when placing an application into an unmanaged state how the proportional widget updates a few seconds later? Dashboard widgets can refresh their data model without having to reload the entire page. In classic Orion views, this change in status may take up to 5 minutes to become apparent.

Happy Dashboarding!
Please let us know what you think, where we have done well, where can we do better.