Since we launched the PerfStack feature in the beginning of 2017, we have seen a lot of interesting use cases from our customers. If you are unfamiliar with PerfStack, you can check out Drag & Drop Answers to Your Toughest IT Questions, where aLTeReGo outlines the basic functions of the feature. Those that are familiar have come to realize just how powerful the feature is for troubleshooting issues within their environment. Whether you're a system, network, virtualization, storage, or other IT administrator, being able to see metric data across the entire infrastructure stack is very valuable.
One of the common use cases I hear about lately, is visualizing synthetic web transaction metrics in the context of application performance metrics. For instance, lets say you have an intranet site and you need to monitor it for performance issues, including end users access and performance from multiple locations. With WPM and SAM, this is a reality. However, before PerfStack, you needed to browse multiple pages to compare metric data against each other.
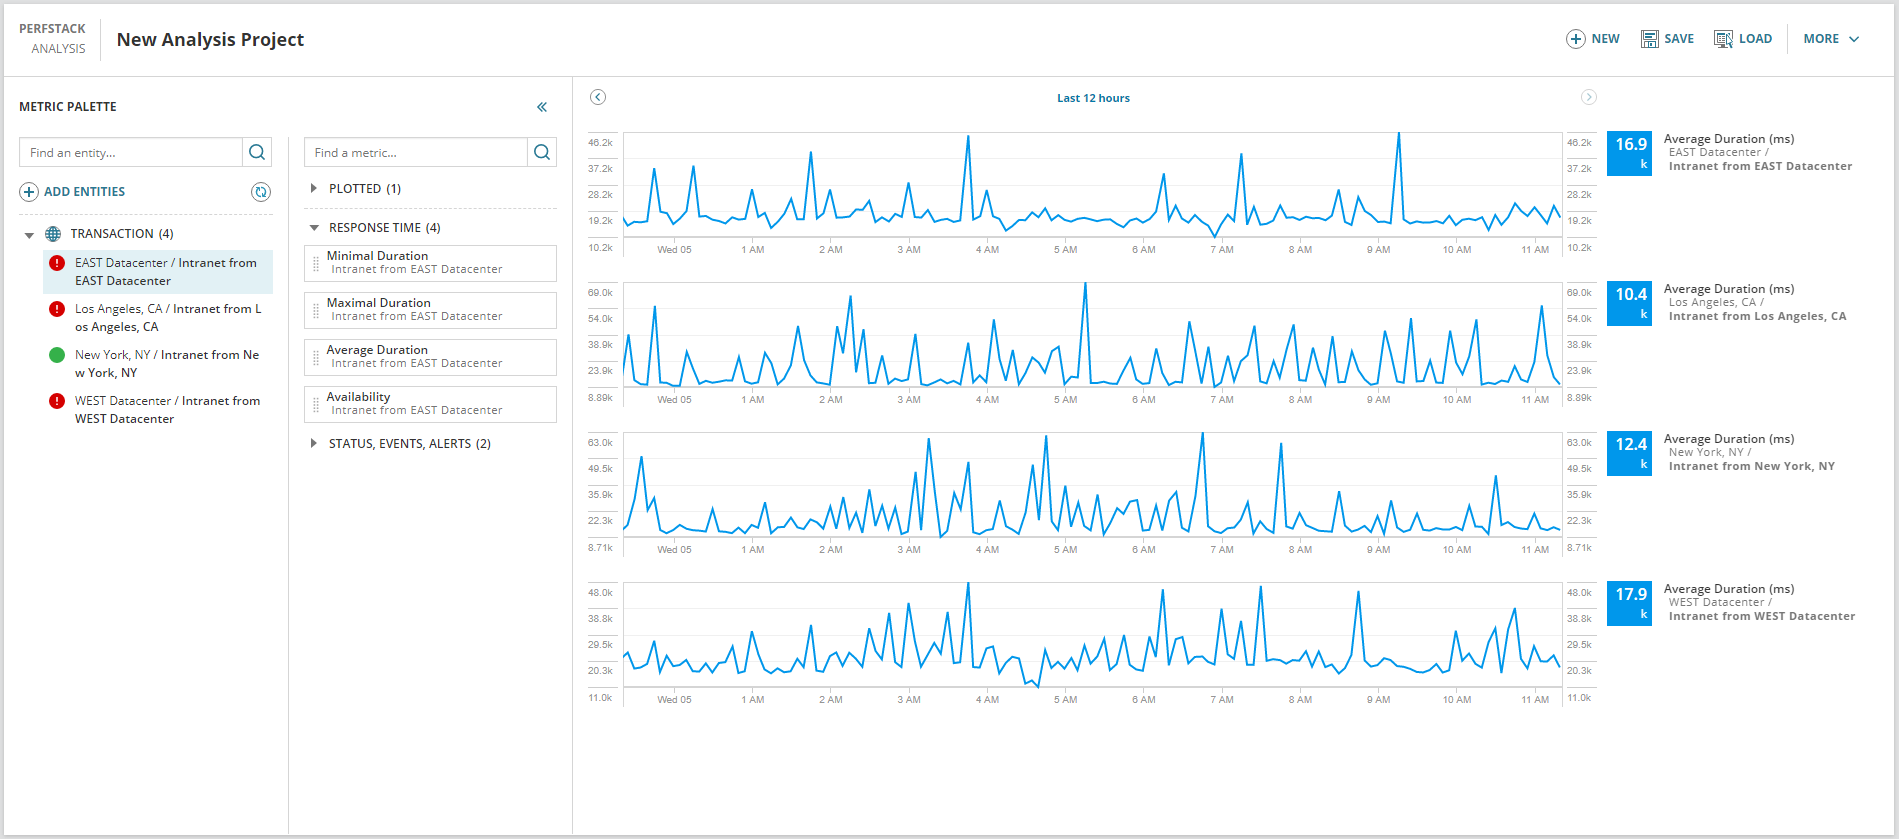
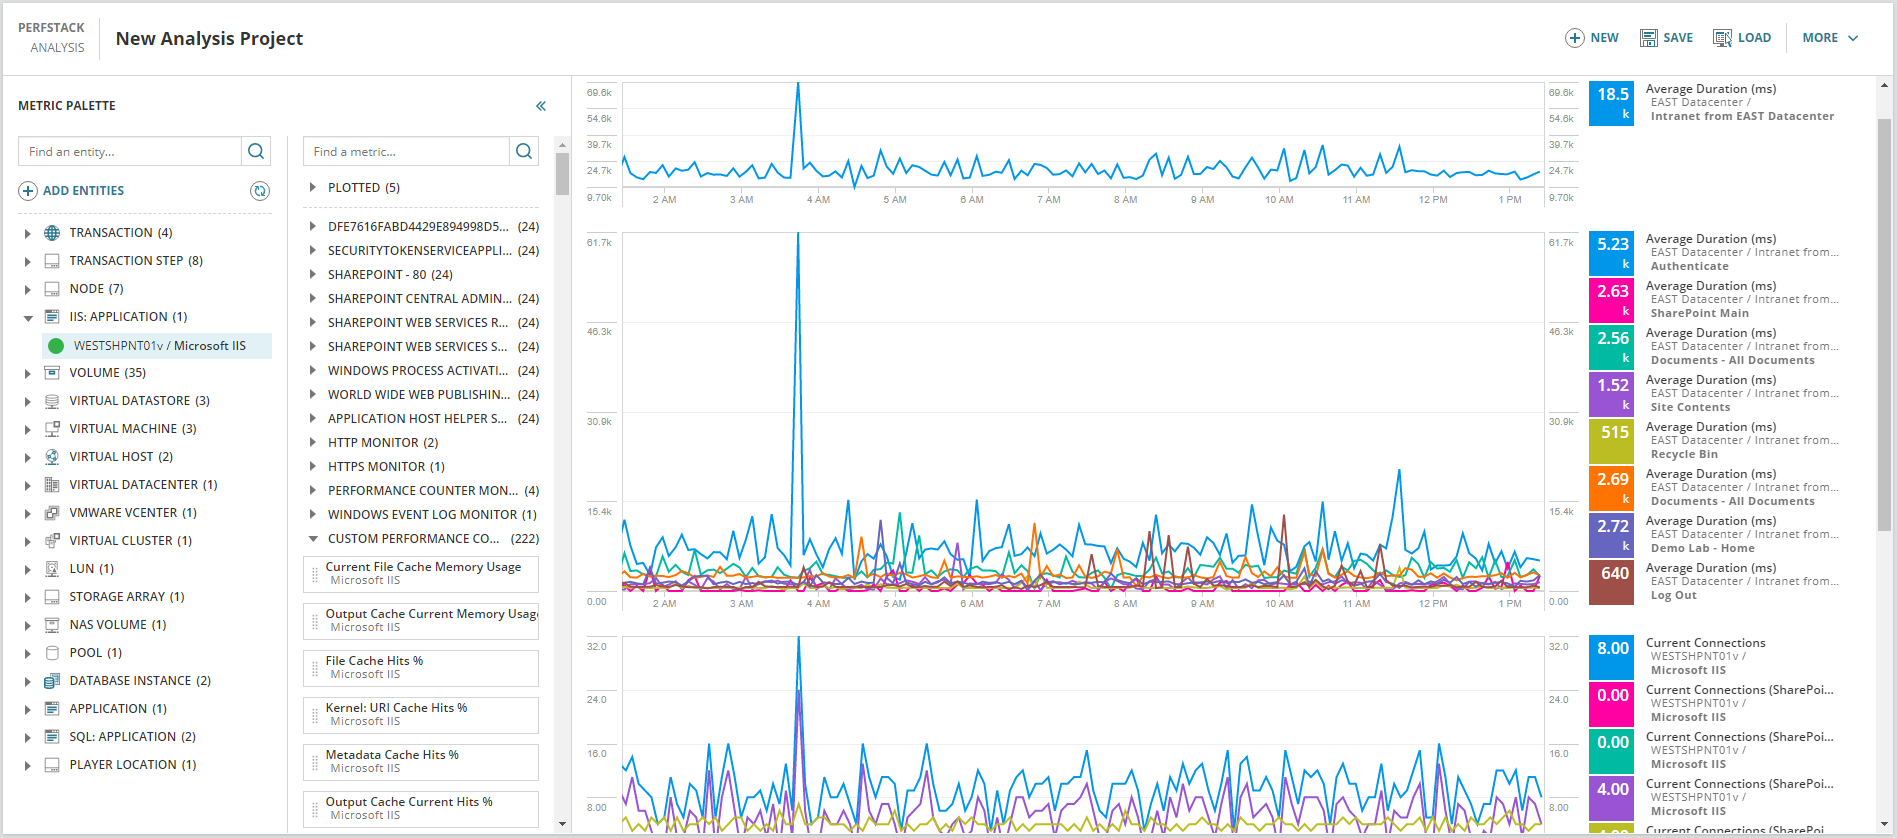
In PerfStack, you can easily add all of the response times for WPM transactions, from multiple locations, to a single metric palette, and quickly visualize those metrics together. In the scenario of the intranet site mentioned above, you can see the response time average duration, from each of the four locations that are monitoring this particular transaction.
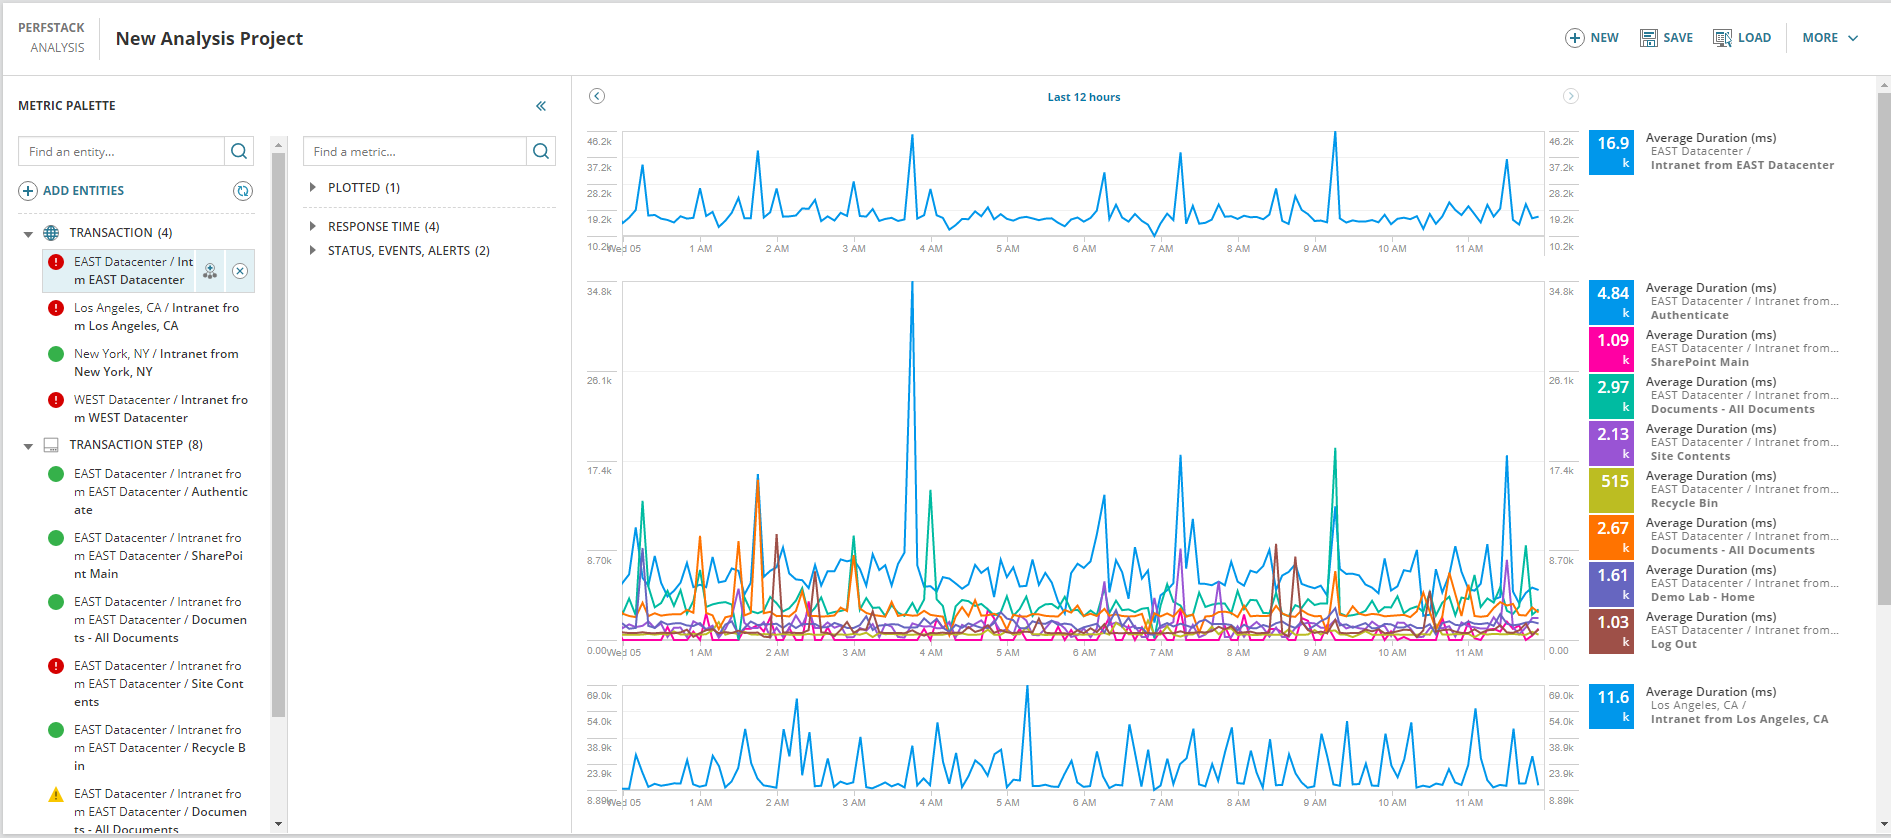
You can also easily add all of the transaction steps, for a particular transaction, to provide a more granular view of the response time of your web applications. All you have to do is click on the related entities icon for a given transaction. Then, add the related transaction step entities and subsequent response time metrics. This will allow you to quickly see which steps are contributing to the elevated response time for the related transaction.
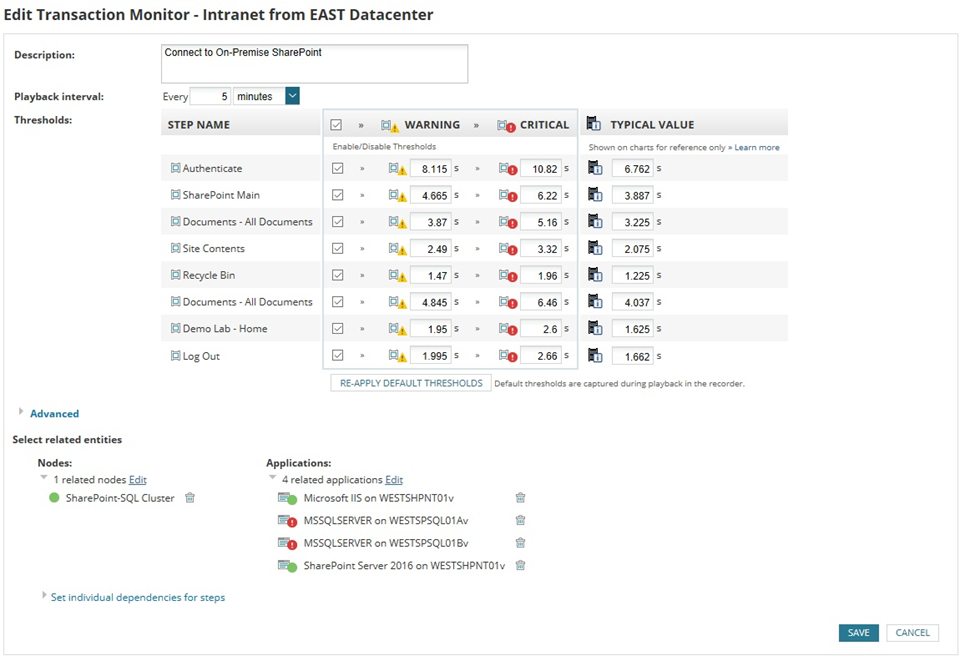
But what about the performance metrics of the application itself, and the infrastructure that hosts it? Those metrics are crucial to determining root cause of application issues. With Perfstack, it is easy to quickly add those metrics to the metric palette when using the related entities function. This does require a pre-requisite to be configured. When configuring your WPM transaction you will need to define related applications and nodes as shown below.
Once that is done, Orion does the rest. As you can see in AppStack, the relationship from the transaction to the application and the rest of the infrastructure stack is fully visible.
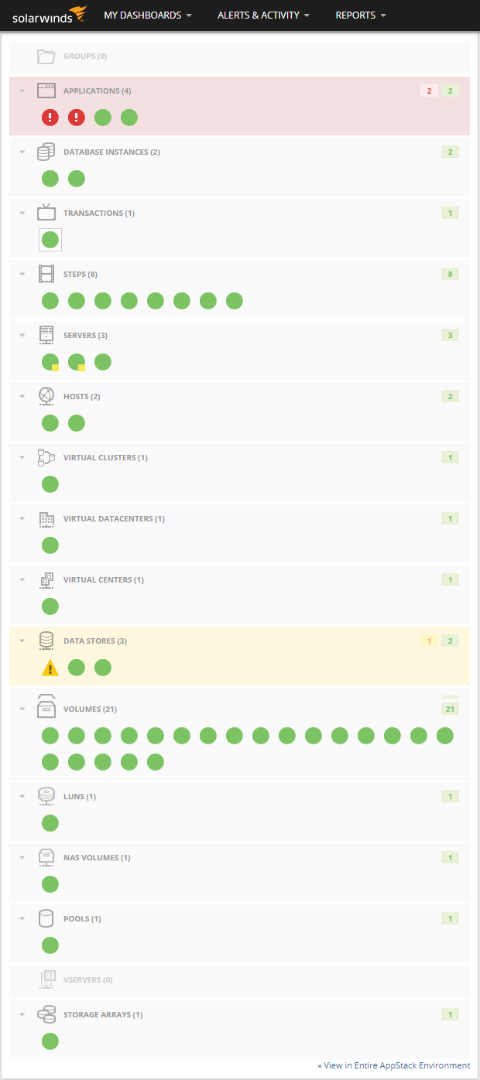
This will allow you to add and remove all of the necessary entities and metrics to a PerfStack project, to complete your troubleshooting efforts. The more Orion Platform products you have, the more entities you will be able to collect metrics from and be able to visualize in PerfStack. Below you can see the multitude of data available through the relationships in Orion. When all of the needed metrics are added, you can save the PerfStack project to recall for future troubleshooting efforts.
We have tried to make it easy to access the data needed to quickly troubleshoot any issues that arise in your environment. With the data at your finger tips you can drastically reduce the mean time to resolution for many issues. We all know that shorter mean time to resolution is important, because performance problems equate to unhappy end user. And when end users aren't happy...
