Maps, in most of the cases are used to show network topology, but there are lots of other benefits users may not be aware of using it. Please share your tips too. Thanks!
Note: most of the functions are based on Topology (e.g. from NPM) and dependency data, so make sure the objects added on a map have that information already.
A few screenshots were taken from @jblankjblankposts
Track History (Time travel)
This would be the easiest enhancement to get on existing maps. Once enabled, users can easily view status changes of the objects in last hours, days, etc.. It could also be used as a NOC view to play historical loop.
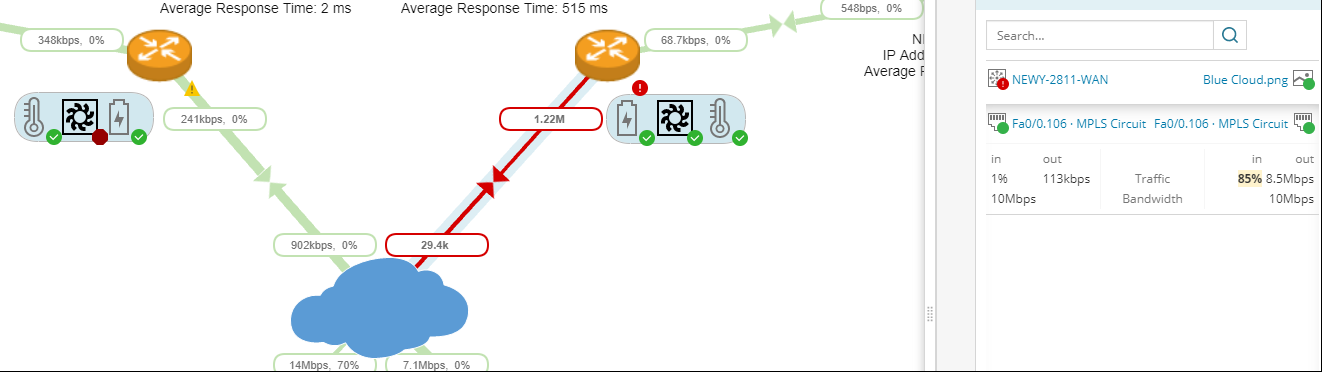
Manually link two objects
In some cases, users may not be able to monitor/collect data from all nodes/links formed their business service, such as devices in cloud, managed by MSP/ISP, MPLS/SD-WAN connections. Manually connect entity objects gives you the flexibility to connect any two objects placed on the map canvas and also show performance metrics using one of the interfaces on either side of the node.
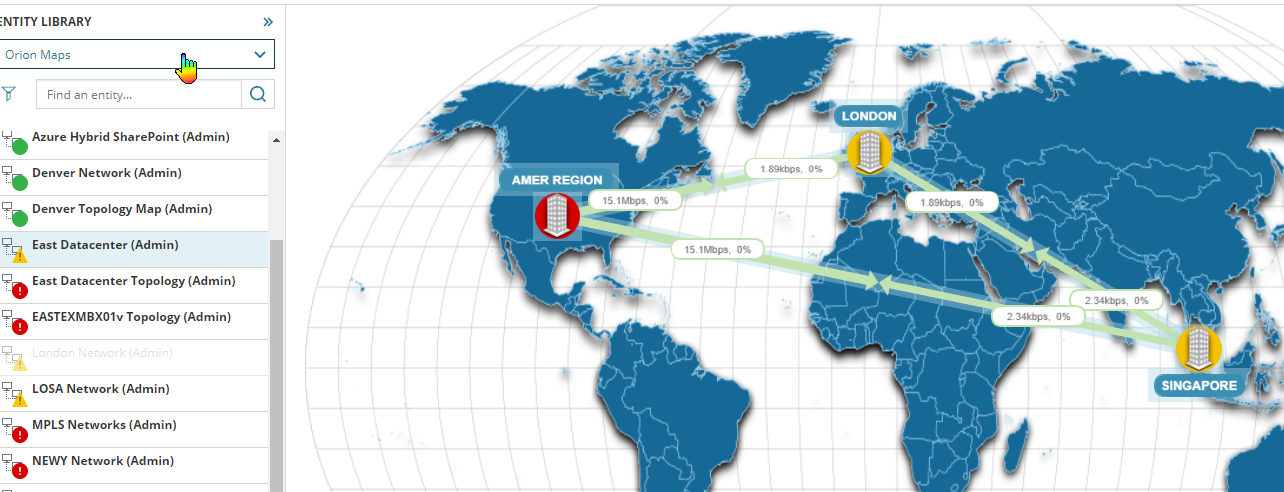
Nested Map
Simply drag a map (e.g. state level map) and drop it onto current map (e.g. global level map) to form a nested map. So when users browse the global map, they can see overall status of different states and are able to click and drill down to the problem state map for more details.
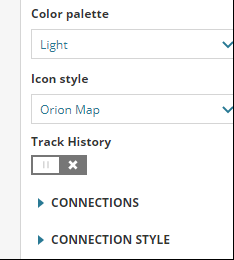
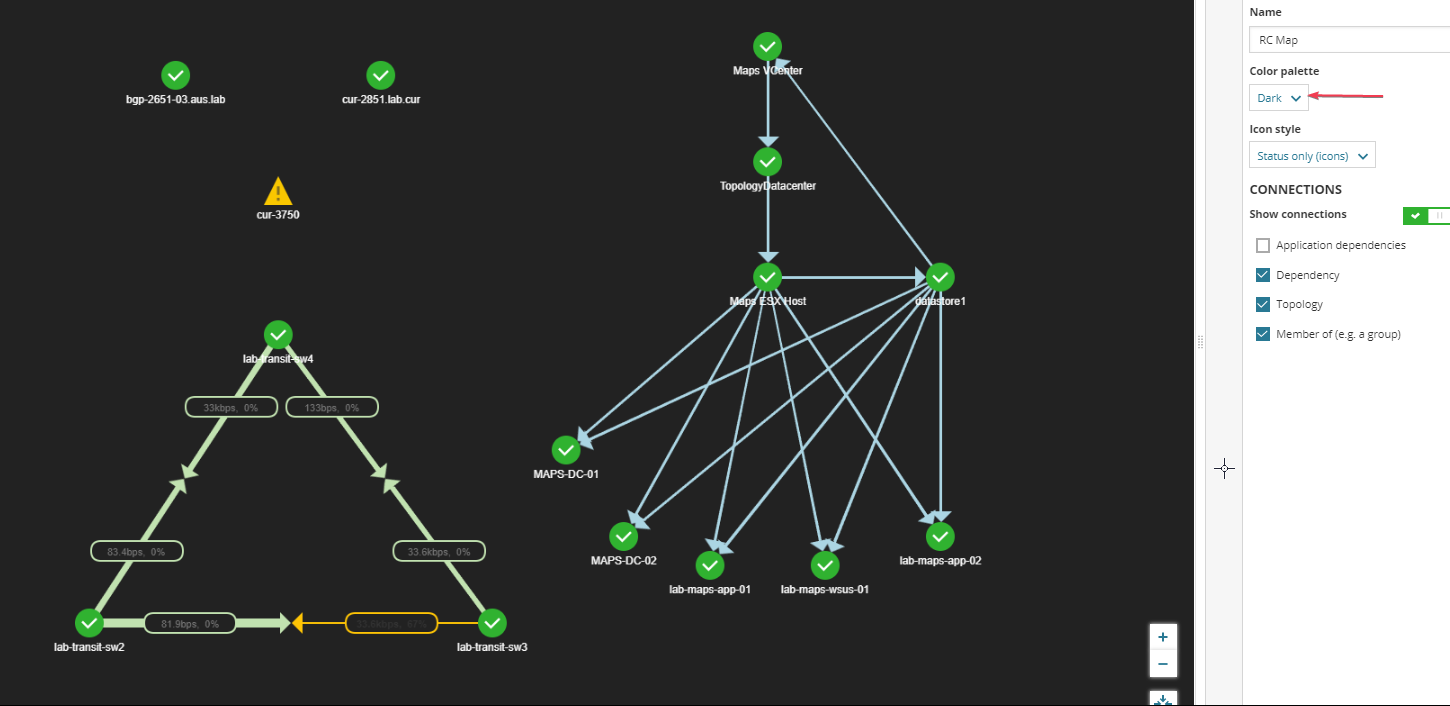
Dark Theme
If you've used to a dark background, you can get it now in Orion Maps.
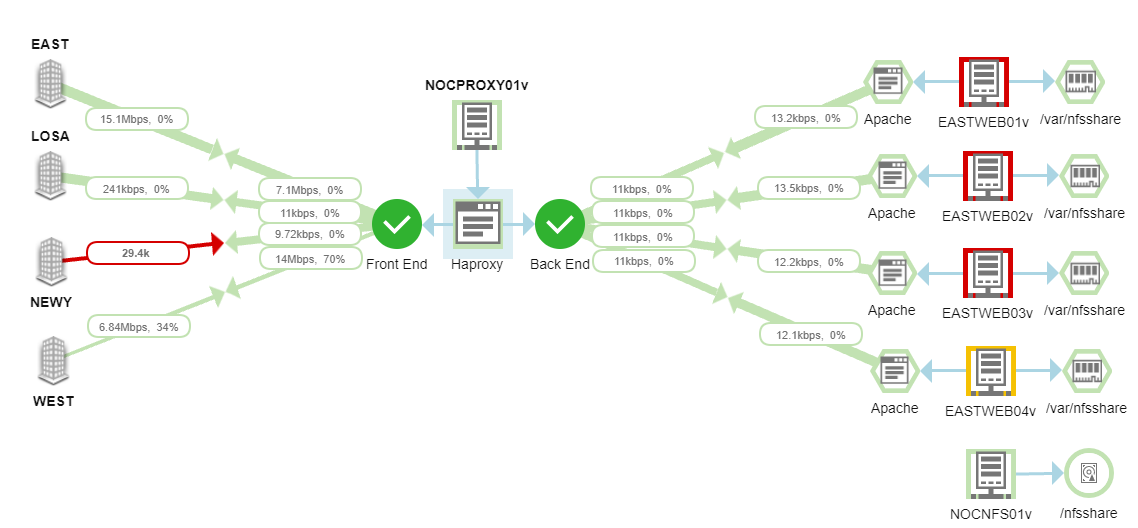
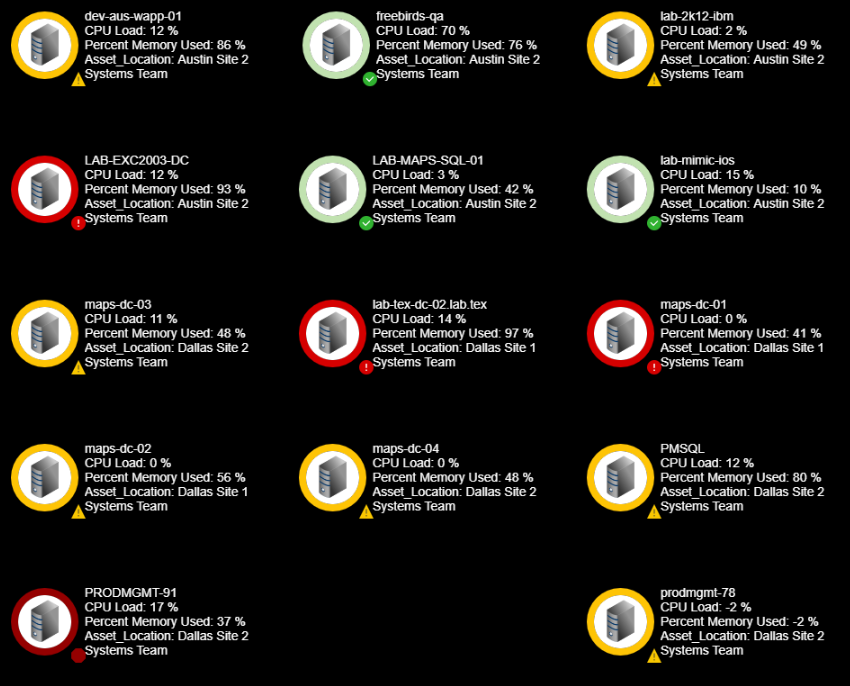
Showing critical objects status and performance data
Instead of using charts and table widgets, Maps could also be used to show performance data of critical nodes, applications, etc.
Application Dependency Connection
In SAM v6.6 and later, Orion can detect how applications talk to each other. This can then be used in Orion Map to visualize transaction flows.