I'm trying to troubleshoot a handful of alerts that I think aren't sending emails, but I don't know where to look to confirm. Where does Orion log its mail sending actions?
I got this query yesterday from Shane on the customer support team and it showed exactly what I was looking for:
SELECT TOP 1000 * FROM [dbo].[AlertHistoryView]
where alertid = <ID of the alert I'm troubleshooting>
order by 3 desc
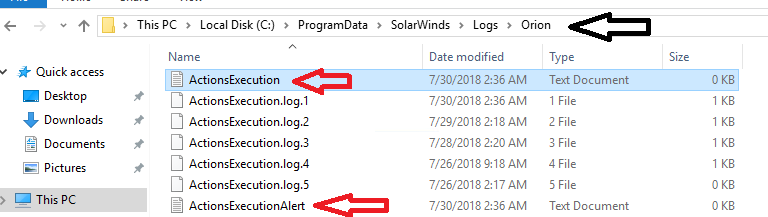
Try looking at these logs and scroll to the bottom.
The only email reference I'm seeing is issues with a PDF that doesn't exist for attaching to an automated report. Is there some kind of transaction log that shows something along the lines of "email sent to <address> at <time> as part of <alert>"?
when you simulate the alert from the actions tab do you get the email?
No, but only because simulate doesn't send an email, just simulates it
When I execute an email action for which I'm a recipient, yes I receive the email. I'm trying to see if a specific alert has successfully sent the email before, and I'm not on the distribution list the email is going to. I do not have access to our email server or logs and was really hoping to see logs within Orion showing the actions performed.
I tend to go straight to NPM's Message Center, then filter for the items I need, and look up the actions associated with them. Editing the actions helps when you can see what happened, what action was taken or NOT taken.
This is a very useful utility, but I'm not seeing the information I'm looking for. It's listing the events I can already see on the application details page. I specifically need to see messages about attempts to send email.
Example of what I'm getting in Message Center:
7/12/2018 4:32:22 PM Event
Component "Product.Metadater Windows Service" for application "Product Services" on node "Servername" is up
Component "Product.SingleCatfisher Windows Service" for application "Product Services" on node "Servername" is up
Component "Product.DownloadCleaner Windows Service" for application "Product Services" on node "Servername" is up
Component "Product.VolumeIndexer Windows Service" for application "Product Services" on node "Servername" is down
Component "Product.MetadataUpdater Windows Service" for application "Product Services" on node "Servername" is up
Component "Product.MissingMetadater Windows Service" for application "Product Services" on node "Servername" is up
Application "Product Services" on node "Servername" is down
7/12/2018 4:30:51 PM Event
Servername - vmxnet3 Ethernet Adapter #2 · ACI is managed again
7/12/2018 4:30:46 PM Event
Component "Windows Scheduled Tasks Component Monitor" for application "Windows Scheduled Tasks" on node "Servername" is up
Application "Windows Scheduled Tasks" on node "Servername" is up
7/12/2018 4:30:41 PM Event
Application "Product Services" on node "Servername" is managed again. Polling and statistics collection have been resumed.
Application "Windows Scheduled Tasks" on node "Servername" is managed again. Polling and statistics collection have been resumed.
Do you find useful information in Admin > Alerts & Reports > Manage Alerts > Alert Manager or Action Manager? It's a start, and shows what alerts are enabled or disabled.
I keep a Resource on NPM's front page called Last 25 Events that is helpful, but it's still not what I think you want . . .
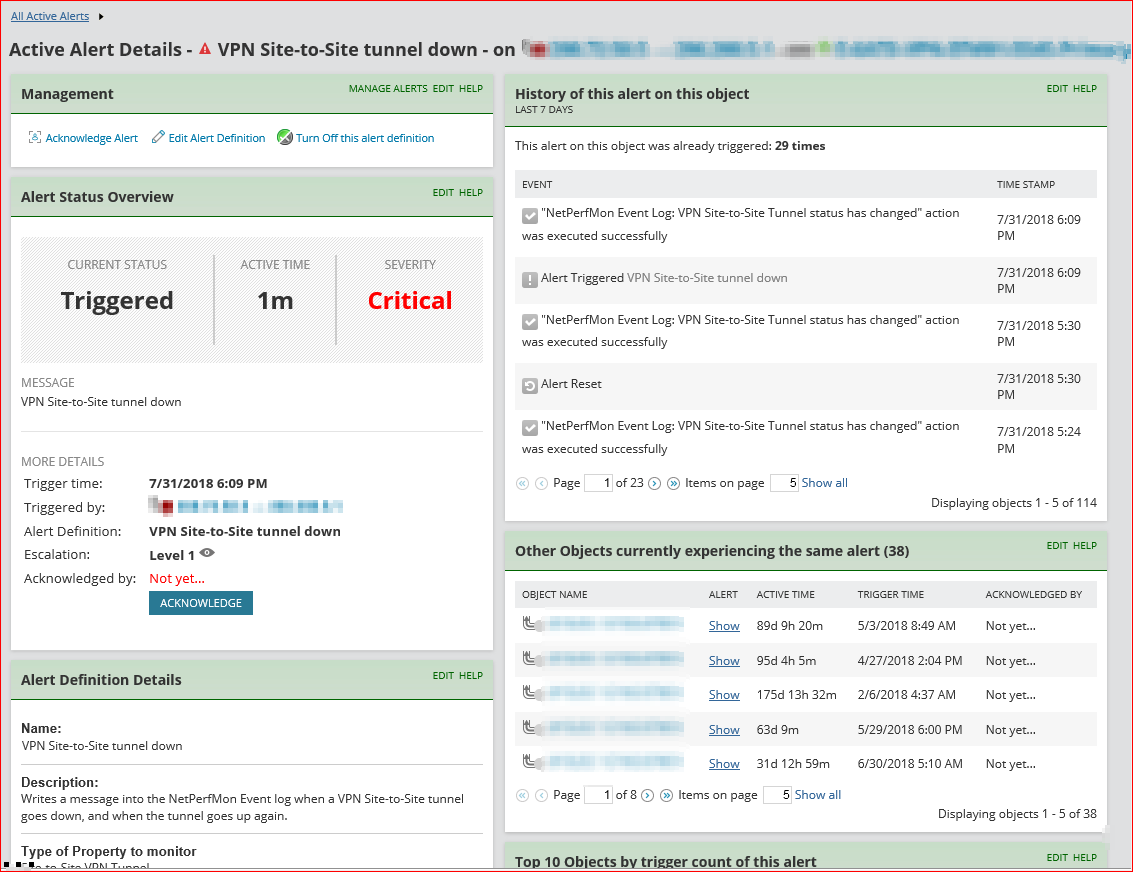
I bet we'd be closer in Alerts & Activity > All Active Alerts. It shows Objects that triggered every alert. If I click on a node that triggered an alert, I can see what it did.
I can also see the name of the Alert, and I build my alerts to help make intuitive the actions each one is expected to perform. I can click on that Alert, see how many times it was triggered, it's whole history, its definition . . .
Naw, this still isn't the e-mail listing you want. At least I think that you want a log of devices that had alerts and NPM was supposed to do something about them, like send an e-mail or a page.
I know it's there; I've seen the data you need. Maybe not all events in the same area--perhaps on a per-device or per-event basis?
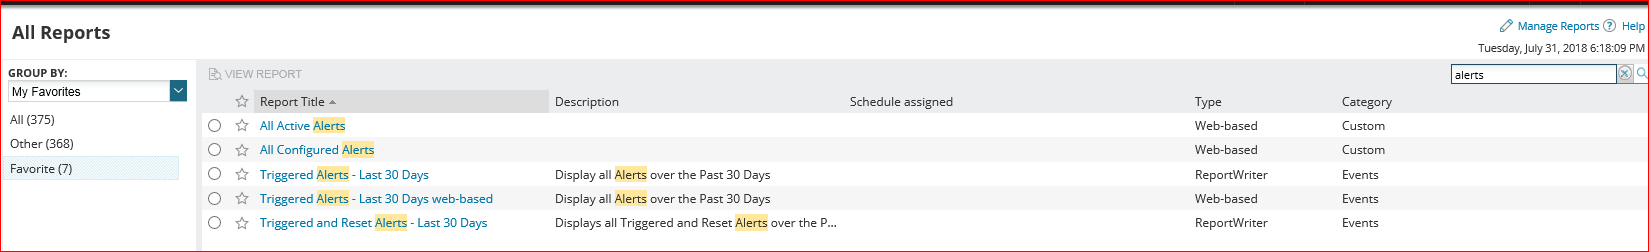
How about here: