I'm looking at the IIS AppInsight chart for IIS Average Network Traffic, and I'm not sure exactly what it's telling me. The help page for the object simply states that it shows the history of IIS network traffic. But is the average showing me network traffic throughput in a specific slice of time, or is it the network traffic in aggregate?
By way of example: my server was rebooted on 1/13. Network traffic shows as zero,which makes sense. Monday 1/14 shows an average of 14.6 GB. Tuesday 35.6 GB. It keeps trending upwards, to the point that yesterday (1/27) the average is 207.6 GB (see chart below).
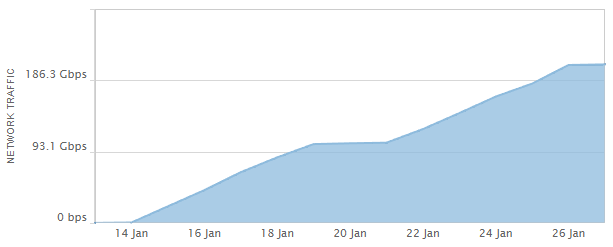
This doesn't make much sense to me; my user base is fairly static, and they don't access the site on weekends. So why would AppInsight for IIS be telling me that there was over two hundred gigs of traffic in a single day that the site wasn't even in use, but two weeks prior there was only fourteen?
Further muddying the waters, in looking at statistical data for the past month, it tells me that the server had roughly 198 GB of total throughput, which indicates that there simply is no way that the server could have had over two hundred gigs of network traffic just yesterday.
Can anyone confirm what this chart is really displaying?