Hello THWACK community,
I'm looking to have an alert triggered on interfaces where CRC errors are occurring. I've found a few similar posts, but none of them have answers. The question is: what is the best method of creating an alert for when a CRC error is detected on an interface via polling.
In the alert builder I found the following fields on the interfaces:
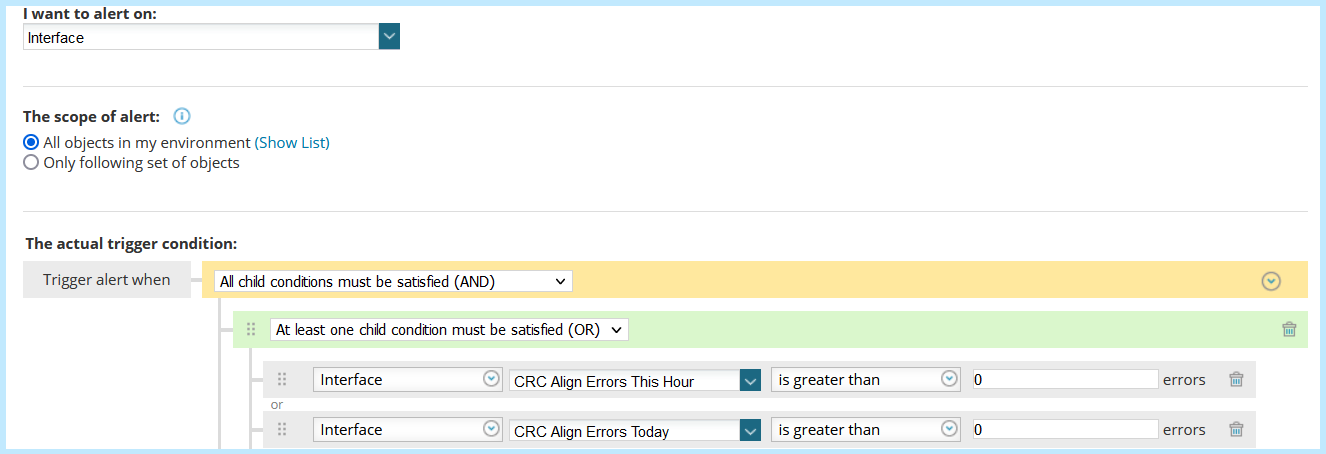
We want to be more instantaneous than hourly or daily though. I looked at the Orion.NPM.Interfaces that entity doesn't appear to have current counts (per polling cycle), just hourly & daily.
The entity Orion.NPM.InterfaceErrors does appear to have current stats, but this is a historical data entity which as I understand it would require a partition to sort correctly. I did that in SQL instead of SWQL:
SELECT Interfaces.FullName, Interfaces.InterfaceID FROM Interfaces
--The above row must stay the same for the purposes of an Orion alert Custom SQL. To get it to work in MSSQL Studio use:
--SELECT Interfaces.FullName, Interfaces.InterfaceID FROM [SolarWindsOrionNPM2].[dbo].[Interfaces] Interfaces
WHERE Interfaces.InterfaceID IN (
    SELECT
        TempTable.InterfaceID
    FROM (
        SELECT
                IE.InterfaceID
            ,   IE.CRCAlignErrors
            ,   ROW_NUMBER() OVER(PARTITION BY IE.InterfaceID ORDER BY IE.DateTime DESC) AS [RowNum]
        FROM [SolarWindsOrionNPM2].[dbo].[InterfaceErrors] IE
        INNER JOIN [SolarWindsOrionNPM2].[dbo].[Nodes] N ON IE.NodeID = N.NodeID
        WHERE N.Vendor = 'Cisco'
    ) AS TempTable
    WHERE
		TempTable.RowNum = 1  --Gets the most recent record for each interface
		AND
		TempTable.CRCAlignErrors > 0   --And where there is a current CRC error(s)
)
The problem is that this query takes about 20 seconds on average. We still have a bunch of interfaces to add to monitoring. I could add a custom property to the interfaces that has to be included in the WHERE clause to reduce the number returned, but I don't know if that would reduce the query time much if at all. I'm concerned that this would start hitting the T-SQL query timeout, and cause slowness in Orion especially if we're going to run this every 2-5 minutes to ensure that the query doesn't miss any polling cycles where interface statistics are collected.
Aside from traps or syslog, is there a native way to get this via polling?
References to other threads:
https://thwack.solarwinds.com/resources/thwack-command-center/f/forum/33845/how-to-generate-an-alert-based-on-crc-errors-for-the-nodes
https://thwack.solarwinds.com/product-forums/network-performance-monitor-npm/f/forum/81809/received-errors-on-interface-versus-crc-errors-this-hour
https://thwack.solarwinds.com/product-forums/network-performance-monitor-npm/f/forum/89524/clarification-on-crc-errors-this-hour
https://thwack.solarwinds.com/product-forums/network-performance-monitor-npm/f/forum/92055/how-to-manage-alert-in-interface-crc-errors
https://thwack.solarwinds.com/product-forums/network-performance-monitor-npm/f/forum/66783/is-it-possible-to-monitor-crc-errors-for-ports-on-the-brocade-san-switches
https://thwack.solarwinds.com/product-forums/network-performance-monitor-npm/f/forum/26744/monitor-crc-error-in-cisco-nexus-switch-5k-series