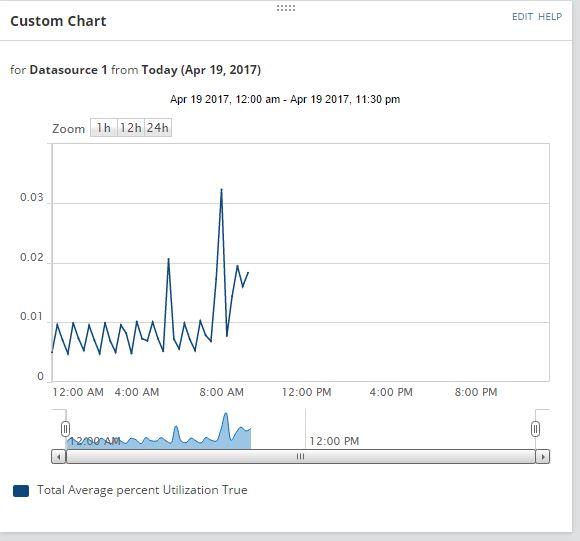
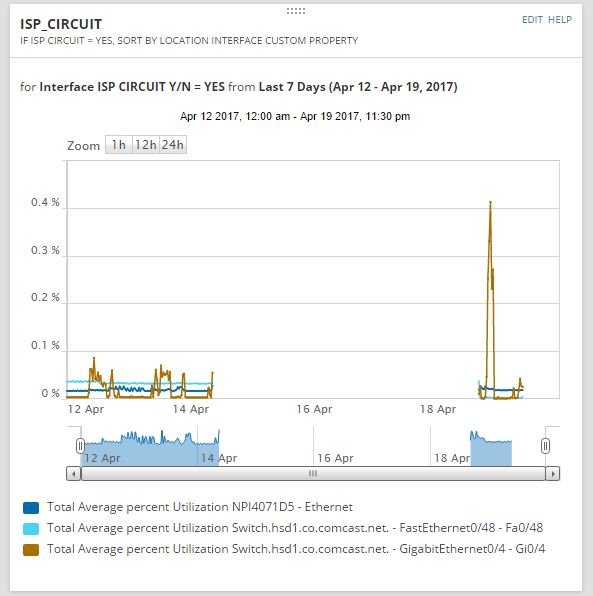
I'm trying to create a custom chart that has the bandwidth utilization average % of 2 individual interfaces located on two different routers, and on that same chart, have both interfaces' utilization combined and represented as one line, into one graph. I've been able to produce the charts individually, but how can i combine these two to present all this data on one graph? The two pictures below show "Custom Chart", which has the two interfaces i'm curious about grouped together, the "ISP_Circuit", shows the individual interfaces (and has one additional interface that i don't need the stats on).