When Looking at some of our ESX servers, I find the following confusing:
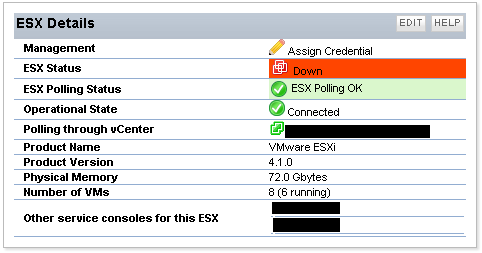
The ESX Polling Status is OK
The Operational State is Connected
The ESX Status is DOWN
Can someone explain that to me please?
Chris,
Usually this is pulled from the VCenter/Vshpere API when logging into it to collect data. If you were to connect to the host using your Vsphere client and look at the status, what does that specific server show in terms of status?
Regards,
Matthew Harvey
Loop1 Systems
http://www.loop1systems.com
The only thing vSphere shows is a memory usage alarm for this specific ESX. I wouldn't expect that to translate to a "DOWN" status.
Odd, it seems to be showing the alerted status as down, though, from what I've seen working on this with other versions, it's usually due to a status change on the host itself that would be seen as a yellow triangle or red triangle on the VSphere Client. I wonder if SolarWinds VIM Management in NPM doesn't know how to translate the critical over and is just showing down instead.
When I look in the netperfmon db for the specific esx in the VIM_Hosts table I see the following:
OverallStatus: Red
ManagedStatus: 2
HostStatus: 2
ConfigStatus: Green
ConnectionState: connected
Does that give any further insight