Want a simple summary of your NetPath services? You can do it with Custom Tile. It comes out like this:
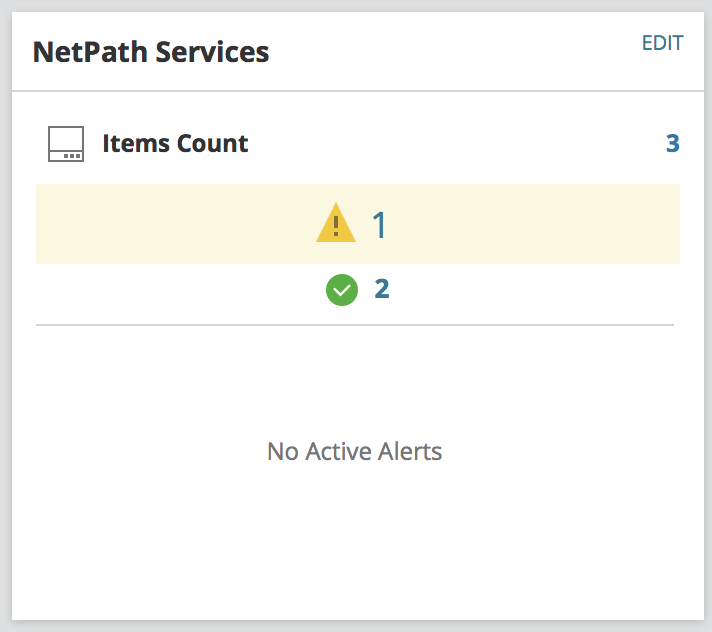
Clicking on any of the statuses or numbers will bring you to that list with naming convention <Service Name> (<Probe Name>):
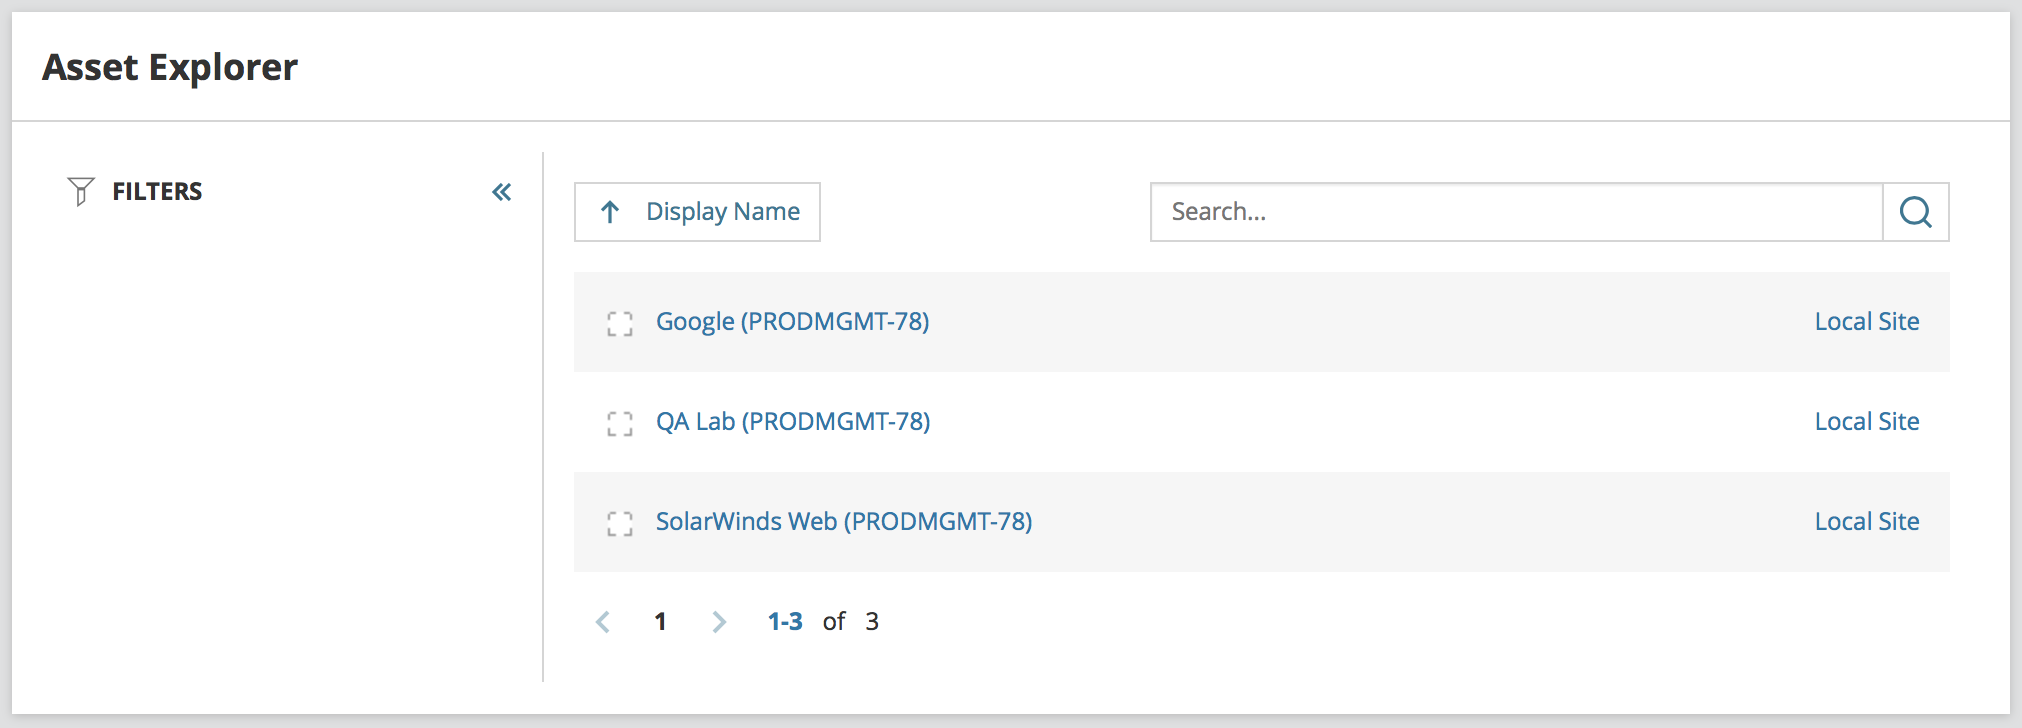
Clicking on a path will take you to the path visualization NetPath is known for.
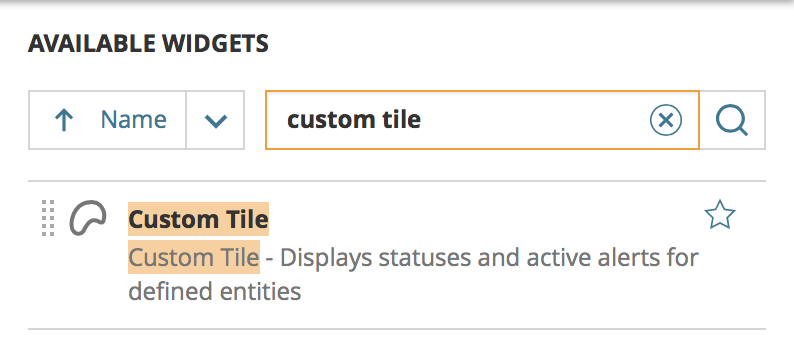
To get this yourself, customize a page and add the "custom tile" widget:
After placing on the page, click "Edit" in the top right of the widget and select one of the NetPath options under Entity Filter:
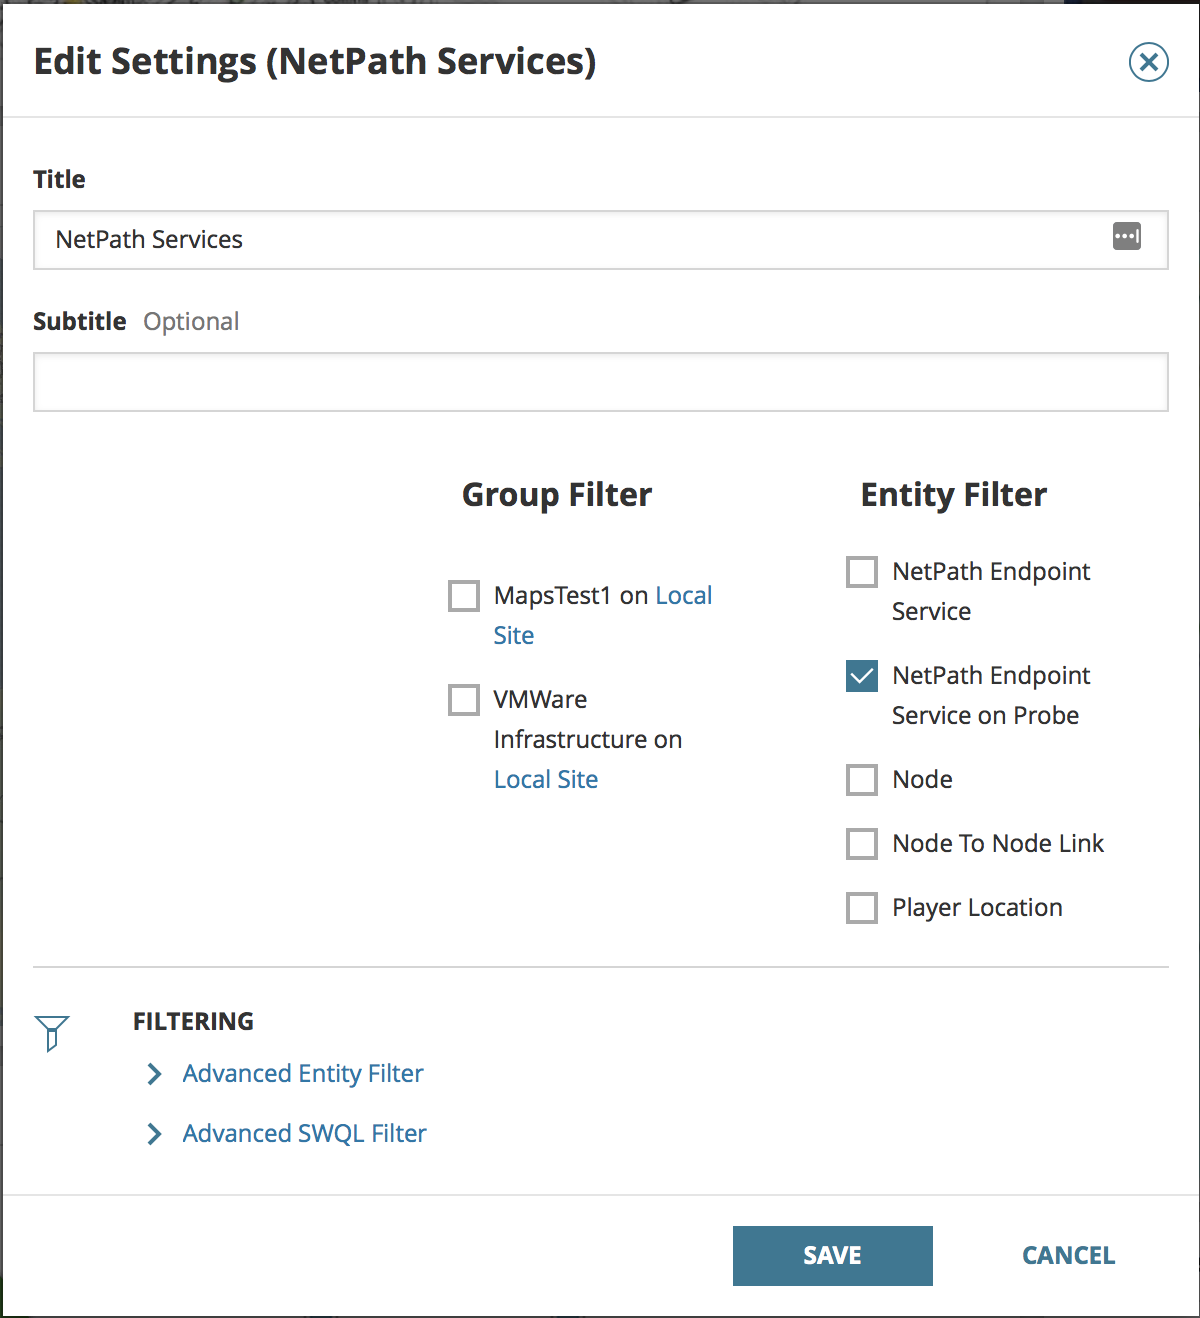
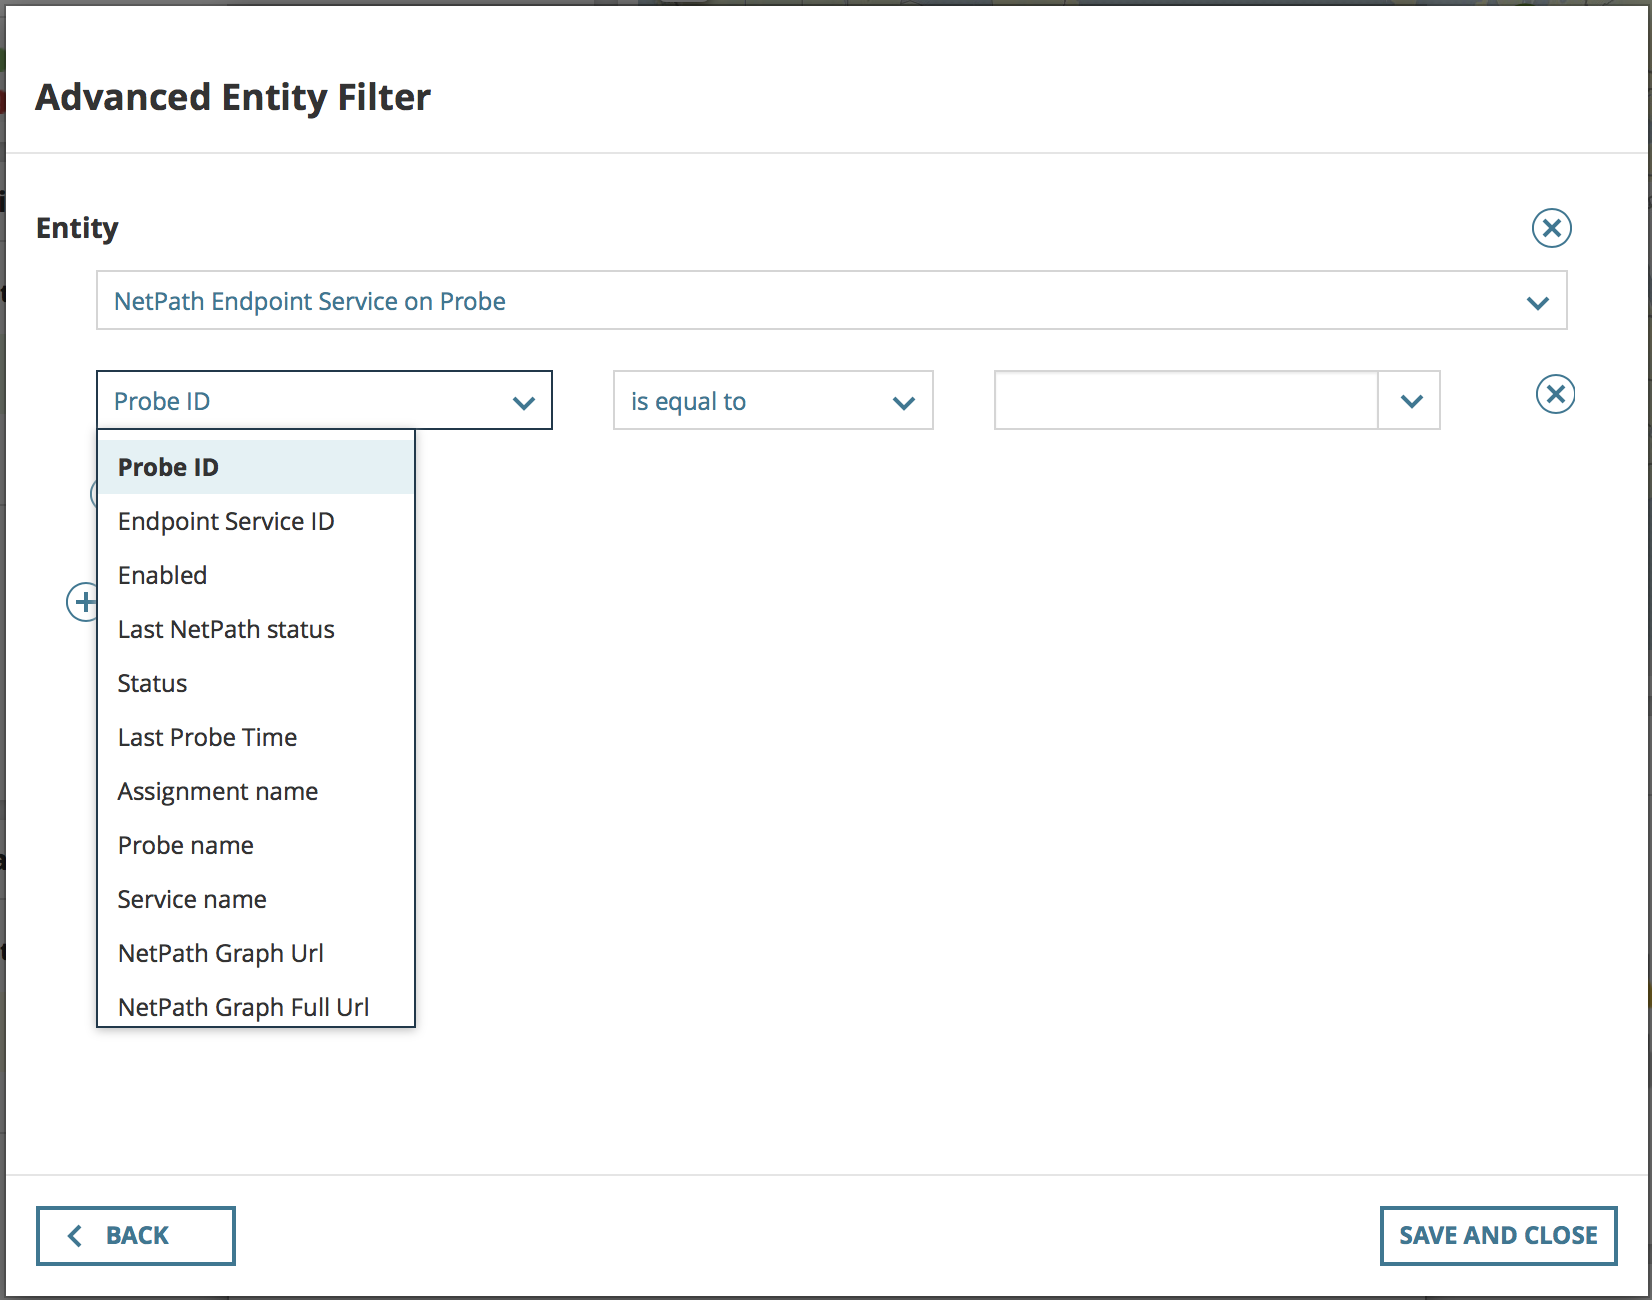
If you want to get fancy, you can add an advanced entity filter and filter to a specific, widely monitored Service, or all sorts of other pivots:
Add several of these to a page to build a dashboard. It's a neat use of a common resource. Thanks to jblankjblank and his team for creating this and showing me this NetPath specific customization.