All,
I'm not sure if I'm misunderstanding how dynamic baseline works because every time I set dynamic baseline on an interface's Received Errors/Discards, the thresholds are set much lower than what they should be.
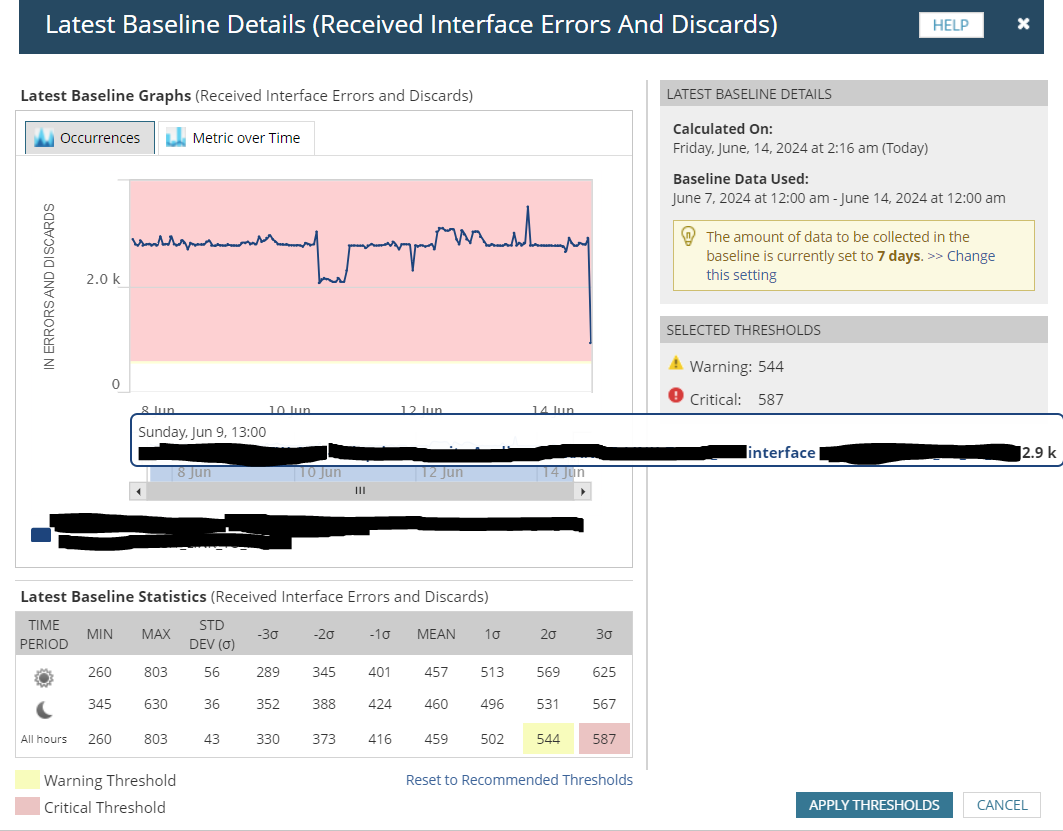
For example, on this interface when I view Latest Baseline Details (using the past 7 days of data):
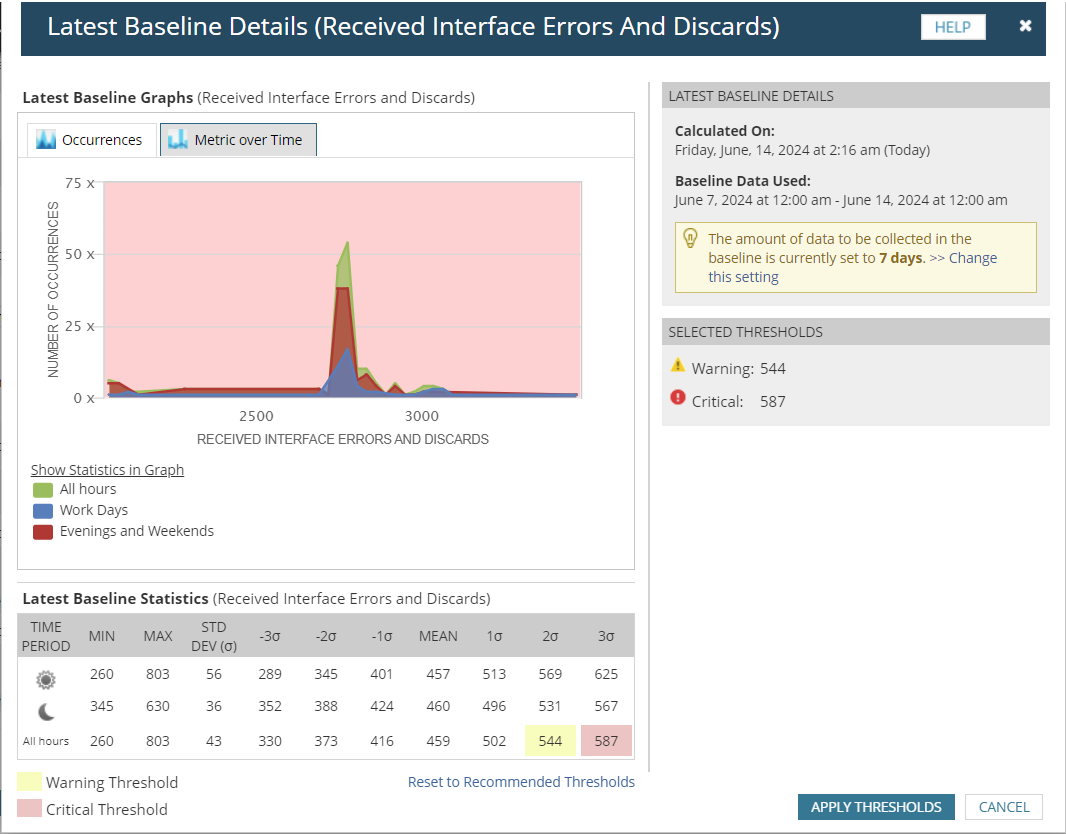
- The Number of Occurences graph shows rather obviously that the vast majority of occurences have a value of around 2750.
- And the Metric over Time graph shows a mostly steady trend at around 2750.
- However in the Latest Baseline Statistics, it's showing an All Hours Min of 260, Max of 803, and Mean of 459.
This mean of 459 is so far off of 2750. It feels like a completely different calculation, or it's calculating from a different dataset.
Shouldn't the mean be somewhere around 2750?
This occurs for several interfaces on the same device - where the dynamic baseline is much lower than what I expect it to be.
1. Does anyone agree with my interpretation of Dynamic Baseline? That it really should be around 2750?
2. Does anyone else have this same problem with Dynamic Baseline being calculated incorrectly?
I've opened a support ticket with SolarWinds and provided diagnostics, but the only answer I received was essentially that it's "working as intended".