Hi,
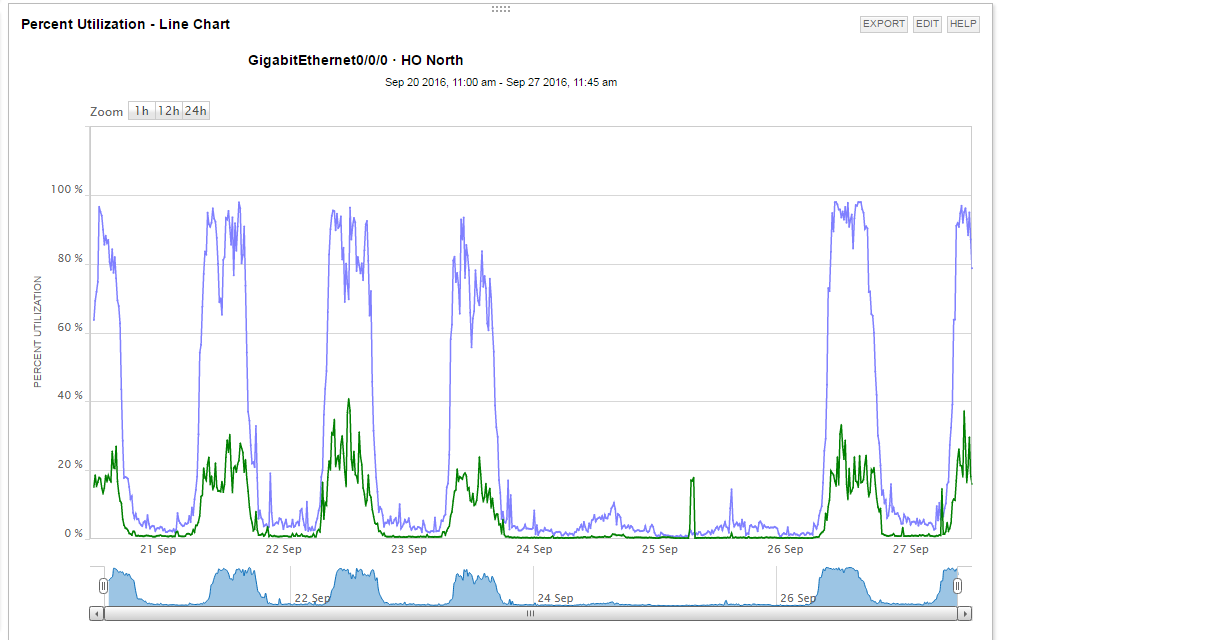
We have three (3) interfaces on a Cisco ASR 1006 router that are configured to send netflow to SolarWinds NTA every 60 seconds. Two of the three interfaces have remained current over the last 48 hours on their netflow data according to 'LastTime' column in the NetflowSources table. See below. However one of the interfaces, GigabitEthernet0/0/0, over the last 48 hours has never been current, and yesterday had a "LastTime" of ~24 hours late, but today "LastTime" for same NIC is only 2 hours late.
This morning I used Wireshark to capture netflows being sent by the aforementioned Cisco ASR 1006 to its NTA flow receiver. I captured data for 5 minutes, and then stopped the capture. I was surprised to see that ~45,000 packets were captured in all, but only 5 of the 45,000 packets contained a PDU for any of the interfaces tagged with "ip flow" in the config.
Two questions:
1. What might explain how one NIC's netflow on said router has been couple hours to 24+ hours old over past couple days, but the other two NICs remain current?
2. Why are 99% of all netflow packets/PDUs sent by said router to SolarWinds NTA for src & dst addresses that do not have netflow enabled (ingress and/out egress) ?
Below is our environment version info. Thanks in advance.
-Matt
Orion Platform 2014.1.0, NPM 10.7, NTA 4.0.3
####################################################################
SELECT
flow.LastTime, node.Caption, ifc.Caption, ifc.InterfaceIndex
FROM
[LenOrion].[dbo].[NetFlowSources] flow,
[LenOrion].[dbo].[Nodes] node,
[LenOrion].[dbo].[Interfaces] ifc
WHERE
node.NodeID=ifc.NodeID and
ifc.InterfaceID=flow.InterfaceID and
node.Caption like 'ROUTER1'
ORDER BY flow.LastTime desc
| LastTime | Node | Interface | InterfaceIndex |
| 2016-09-27 10:45:00 | ROUTER1 | GigabitEthernet0/0/1 | 2 |
| 2016-09-27 10:45:00 | ROUTER1 | GigabitEthernet0/0/0.2 | 9 |
| 2016-09-27 08:41:00 | ROUTER1 | GigabitEthernet0/0/0 | 1 |