This discussion has been locked. The information referenced herein may be inaccurate due to age, software updates, or external references.
You can no longer post new replies to this discussion. If you have a similar question you can start a new discussion in this forum.

Solarwinds DPA Alerts Total SQL Wait Time - Machine shows fewer seconds of wait time than the DPA Waits tab does

We are running Solarwinds DPA on our MS SQL Server machine running SQL Server 14.0.3456.2

We set up the " Total SQL Wait Time - Machine" alert with an execution interval of one hour.  An hour later it tells me the total wait time for that hour was 2 seconds.

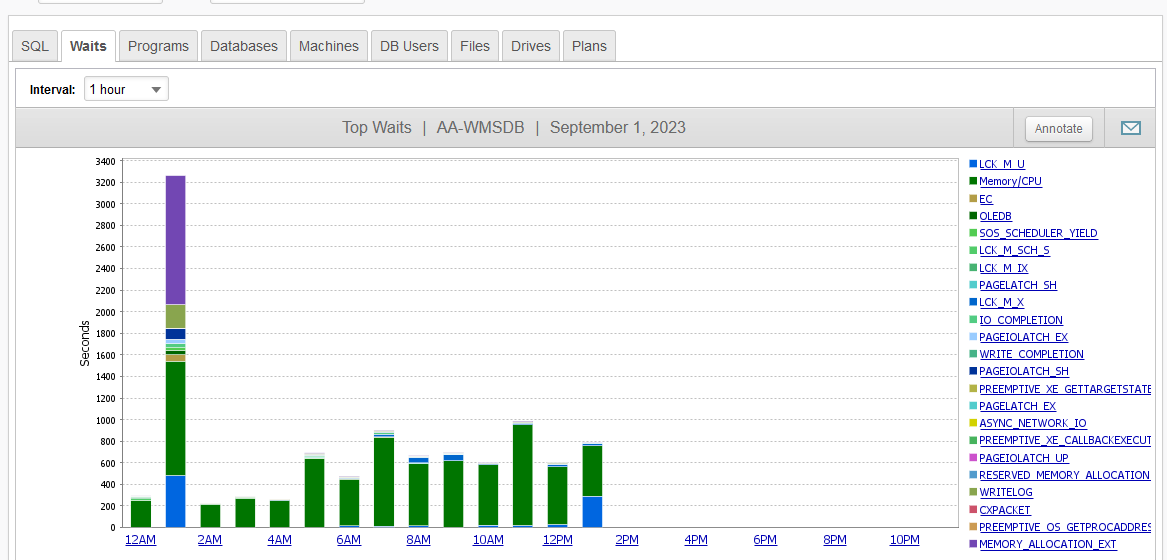
DPA shows the graph below, which I interpret to mean that over the last hour  we were seeing more like 800 seconds of wait time.  What is the cause of this discrepancy, and how can I make the alert more closely match the results in the DPA graph?
alert text is:

Alert: Total SQL Wait Time - Machine

Database Instance: AA-WMSDB

Execution Time: Friday - September 01, 2023 13:42:04

View Alert Status: rp-orion:8123/.../alerts

Alert Parameters:
Machine: AA-WMSDB

Thanks,

Tim

Value: 2 seconds

This message was system-generated. Do not reply to this message

  • Hi    The alert you created "Total SQL Wait Time - Machine" is used to identify the amount of wait time from queries originating from the provided Machine. In your alert configuration, you are only tracking the SQL Queries originating from the DB instance host machine  AA-WMSDB connections to the  AA-WMSDB database instance on the same machine.  The screen capture you have in your attachment above is on the tab "Waits" -- this shows the cumulative and individual time for each of the top-N distinct wait types - for example "LCK_M_U"and "Memory/CPU" (see right hand side legend on that tab).  

    I assume that you were instead wanting the total waits for the last hour on that DB instance -- in which case you should have created the alert using the "Total Database Instance Wait Time" alert type.  

    Note that ALL of the tabs in the "Trends" supertab display total wait times. The difference is how each divvies the total into different slices:

    • SQL Tab - displays each of the the Top-N SQL Query statement (hashids) having the most wait time during that interval
    • Waits Tab - displays the top-N wait types having the most wait time
    • Programs Tab - shows the top-N programs having the most cumulative wait time across all queries made by that program.
    • Databases Tab - shows the top-N databases in that SQL Server having the most cumulative wait time across all queries against that DB
    • Machines Tab - Shows the top-N "Client" Machines originating SQL statements that have the most cumulative wait time
    • DB Users Tab - Shows the top-N DB Users whose queries executed generated the most cumulative wait time
    • Files and Drives Tabs - Show the files and drives having the most access wait times against each
    • Plans Tab - shows the top-N execution plans that had the most cumulative wait time attributed to each.

    In the Alert Creation dialog with the Waits radio button selected, you will see a different alert type corresponding to each of the above Trends tabs.

    There are other wait alerts, but I'd call your attention to the "Database Instance Wait Time Anomaly" alert type -- which uses machine learning/AI to detect when the total wait time experienced is unusual compared to same previous historical periods.  For example, the interval  Tuesday 2:00PM - 3:00 PM total wait would be compared against the history of all prior Tuesdays 2-3 PM.  This is an alert you can set to only fire when there is an unusual amount of activity, not a specific threshold.

    TIP: Apply Multiple Wait FiltersAlso in the DPA UI, click down on each vertical column in the Trends tabs until the columns go horizontal.  At this granularity, you can combine a combination of of the above filter types to see the resultant wait information. You enable multiple filters by clicking on the links in the left hand side horizontal column of a tab. When you do so, that tab disappears and gets added to the breadcrumb filters above the trends page.  Note the SQL filter is enabled differently since clicking on the SQL tab link takes you to the QPA page. On that tab, to add a filter for a particular query, you need to select the query from the "Filter on this Query" pulldown.  Also note that the Timeslice tab, allows you to restrict the time range below the hourly level in increments down as low as per minute. 

    For example, you have a complaint about a performance problem that came from a user "Bill", running the "HR-Reports" application, and Bill's laptop client is "BILL-PC" and happened Yesterday between 10:10 and 10:15.  Using that information, you can create a very granular set of combined wait filters. In this scenario, create a filter on each of the following tabs:

    • User tab for "Bill"
    • Programs tab for "HR-Reports"
    • Machine tab for "BILL-PC"
    • Timeslice tab - select yesterday between 10:00 and 11:00 hour and in the Interval pulldown, select "5 Minutes"
      • Then click on the Timeslice column for 10:10

    At this point the DB Users, Programs, and Machines disappeared and replaced with breadcrumb trail for each. If you click on the SQL Tab, you can see all the total wait time of just the queries that Bill's use of the HR-Reports application executed yesterday between 10:00 and 10:15.

    Also note that the wait time collected is equal to or greater than actual time because DPA adds 1 wait second for every concurrent query executing every second. For example, at time T0, if there are 5 queries currently executing a total of 5 seconds will be added to the total DB instance time. Depending on the other attributes related to each query (e.g., wait type, DB user, machine etc.).

  • Thank you for this in-depth response, this gives me a lot to work with.  I will get started and with this info, I'm confident I will be able to synchronize my alerts with what I'm seeing in the DPA.