Web Performance Monitor is a great tool for monitoring internal and external websites via synthetic transactions. One of the best features within the product is the TCP Waterfall chart which can help to determine if a specific element or elements are causing issues. Unfortunately, at the moment, the chart fails to provide historical data, there is an open feature request and I would recommend you upvote it here, https://thwack.solarwinds.com/product-forums/web-performance-monitor-wpm/i/feature-requests/wpm-needs-to-retain-historical-snapshots-of-tcp-waterfall-data. Until then, you can use the Email a Web Page action in order to capture a screenshot of the waterfall chart when an alert is triggered. Please see below for instructions on how to set this up so that the next time an alert triggers you can also capture that waterfall chart to help assist in troubleshooting the slow down.
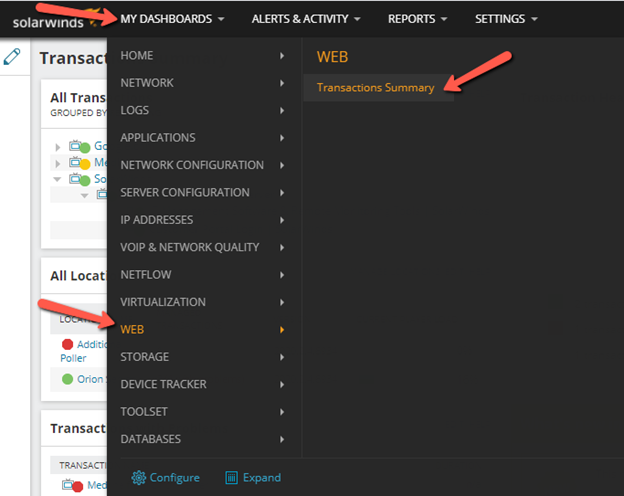
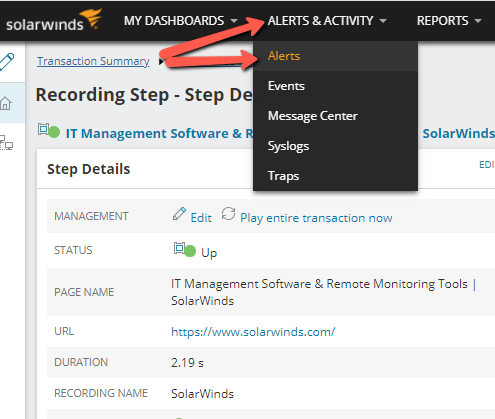
The first step is to retrieve the URL we need in order to input this into the alert action. To do this, within the web console, navigate to the Transactions Summary Page.
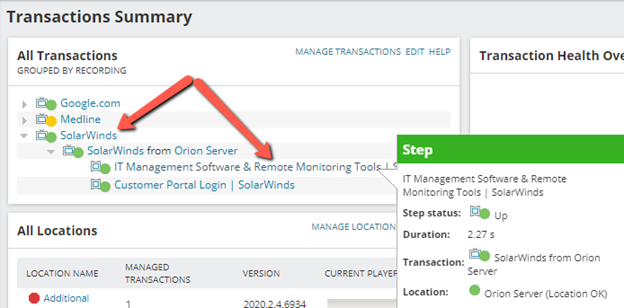
Once on the summary page pick any Transaction and expand to view the steps, then select any of the steps below it.
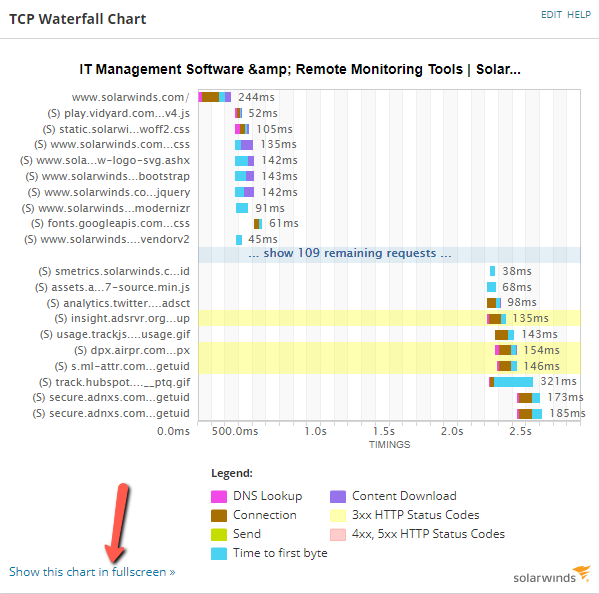
From the Steps Details view locate the TCP Waterfall Chart and click Show this chart in fullscreen.
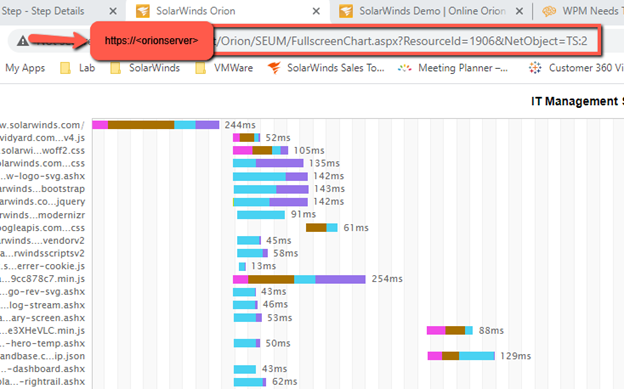
From the TCP Waterfall Chart view copy the URL presented.
Now that we have the URL lets head on over to create the alert. Click on the Alerts & Activity menu and then click Alerts.
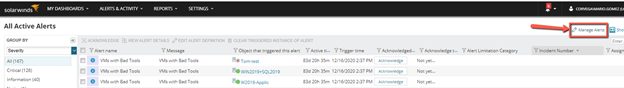
From the All Active Alerts view select Manage Alerts option in the upper right corner.
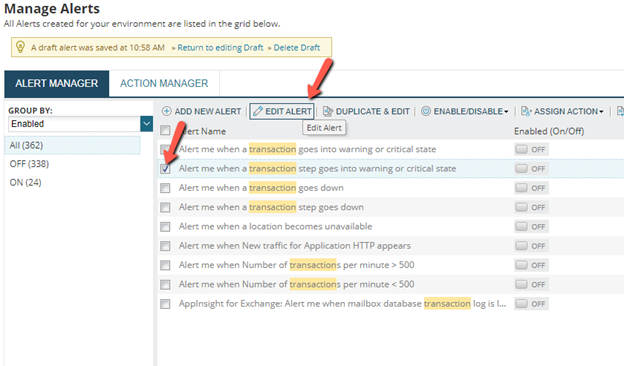
You can search for Transaction using the search function to the right, and locate the alert, Alert me when a transaction step goes into warning or critical state. Select the alert and Edit Alert.
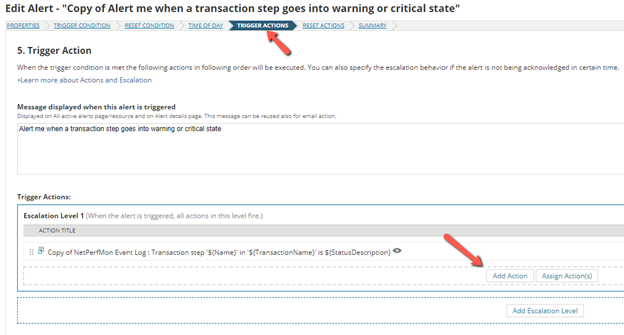
Within the alert, select the Trigger Actions option from the top and then click Add Action.
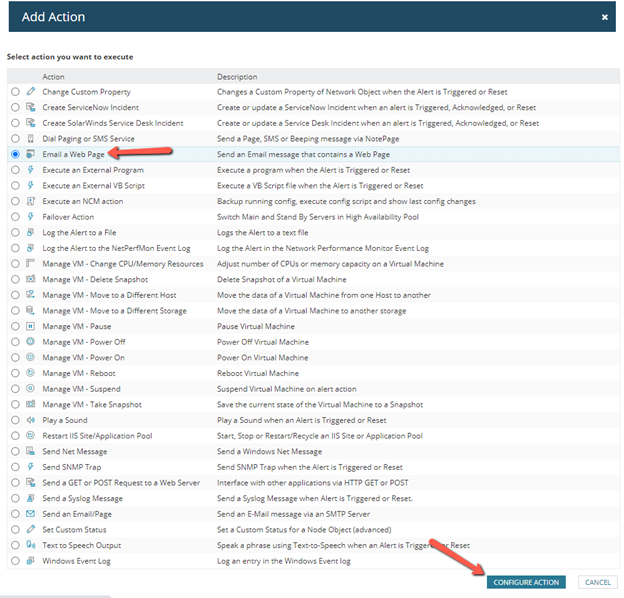
Within the Add Actions view select Email a Web Page and then click Configure Action.
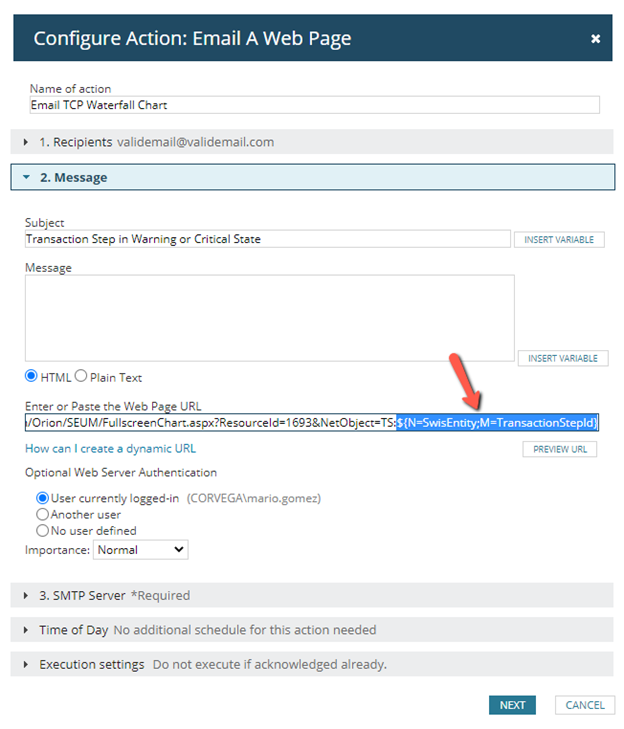
Within the Configure Action view fill out the pertinent information such as Name of Action, Recipients etc. The important piece here is the Enter or Paste the Web Page URL section. Take the URL copied earlier and paste it into this field. We will then modify the URL by removing the number at the end and replacing it with this variable, ${N=SwisEntity;M=TransactionStepId}, so that the URL appears as follows, https://<Orionserver>/Orion/SEUM/FullscreenChart.aspx?ResourceId=1693&NetObject=TS:${N=SwisEntity;M=TransactionStepId}. Again, THIS IS IMPORTANT, the variable is used to reference the ID of the step that is causing the alert to fire.
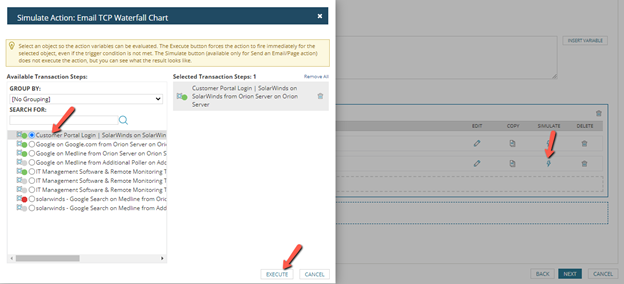
Complete the rest of the setup and if you wish to test it click Simulate, choose an available Transaction step and click the Execute button.
If all is configured properly you should receive an email with a PDF that contains a screenshot of the TCP Waterfall Chart providing you with the information needed to better troubleshoot that slow down.